
Stock Predictor guide
Left Tabs: Companies, Strategies and Indicators
The left panel has three tabs: the companies you are researching, the trading strategies and the chart indicators.
Companies
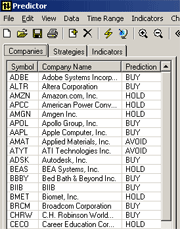
The Companies tab lists the companies you are researching. Load symbols from a file with File > Open, or add them with the  Add Ticker button. Company names are filled in from the stock symbol database that comes with Stock Predictor. If a name cannot be found, for example for a company on an international exchange, the symbol is shown instead.
The Prediction column shows the result of the selected strategy for each stock:
| Prediction | Meaning |
|---|---|
| BUY | A buy signal was generated on the current day at the current price. |
| SELL | A sell signal was generated on the current day at the current price. |
| HOLD | Going back in time, the last signal was a Buy. |
| AVOID | Going back in time, the last signal was a Sell. |
Strategies
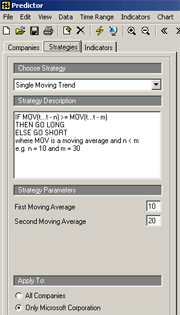
- Choose Strategy – selects one of the built-in technical trading strategies. The last one in the list is the Combined Strategy, which lets you build over 500 custom strategies.
- Strategy Description – a symbolic description of the formula behind the strategy. Editing it does not change the strategy logic.
- Strategy Parameters – the values the strategy uses. Change them to fine-tune the strategy for one stock or a group of stocks.
- Apply to – runs the strategy for the selected stock or for all stocks in the Companies tab.
- Run Strategy – runs the selected strategy. See running a trading strategy.
Indicators
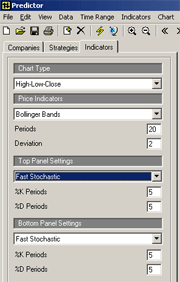
The Indicators tab changes the chart: the chart type (Standard, High-Low-Close or Candlestick), the price indicators and the technical indicators for the chart panels. Click Apply Settings at the bottom of the panel to update the chart. See setting technical indicators.