WinTraceRoute
$19.95Visual traceroute for Windows with min/avg/max RTT, packet loss and a latency graph per hop, plus host name, ASN and country of every router.

PingTrace shows ping and traceroute side by side in one window. Enter a host name, a URL or an IPv4 / IPv6 address and click Start: the left list pings the host and shows each reply with its time, TTL and a latency bar, while the right list traces the route and shows each router on the path with its packet loss, last, minimum, average and maximum round-trip time, jitter (standard deviation) and a latency graph, plus its host name, network owner (ASN and AS name), announced BGP prefix and country.
Download free trial Buy now – $19.95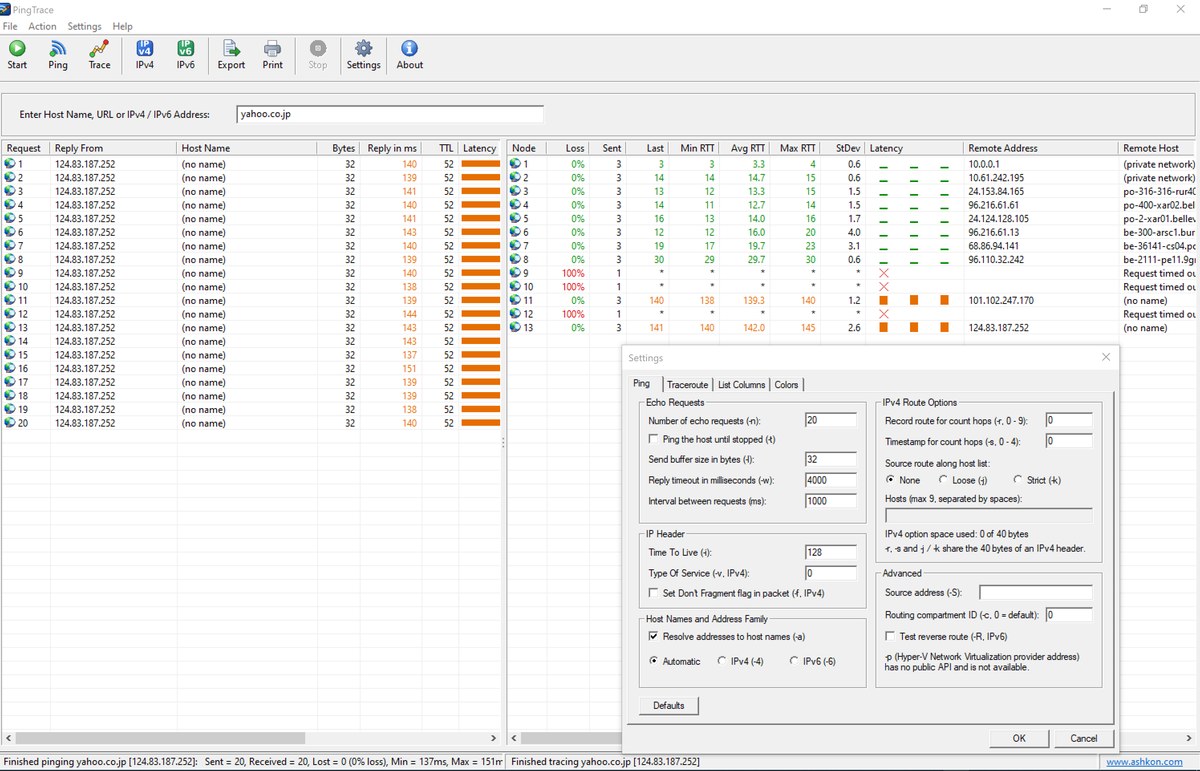
Switch on Continuous Traceroute (MTR) to trace the route again and again and keep running statistics for every hop, the way the popular mtr tool does — the best way to catch intermittent packet loss and latency spikes. Right-click any address to see its Whois / RDAP registration data or to run a TCP Port Check against it. All options of the Windows ping and tracert commands are available in one Settings dialog, latency and loss are colored by thresholds you choose, and results can be exported to CSV or printed. For a full guide please see the PingTrace Help page.
Need a simpler tool or alerts? WinTraceRoute runs a single visual traceroute, and IP Monitoring Tool checks your servers on a schedule and alerts you when one goes down.
The ping list is on the left and the traceroute list is on the right; drag the bar between them to change their widths. The status bar shows the result of the last ping and of the last trace. In the screenshot below yahoo.co.jp is pinged and traced; the Settings dialog is open on top of the results.
At the Windows command prompt it is ping -t. In PingTrace, check Ping the host until stopped (-t) in Settings > Ping and click Start. Every reply is listed with its time, TTL and a latency bar until you press Esc.
Yes. PingTrace has a continuous traceroute (MTR) mode. It traces the route again and again and keeps running Sent, Loss, Last, Min, Avg, Max and StDev values for every hop, the way the mtr tool does.
Run the continuous traceroute for a few minutes and look at the Loss column. Loss that starts at one hop and continues on every hop after it points to that hop. Loss at a single router with no loss on the hops after it usually means that router gives low priority to traceroute replies, not that traffic is lost.
Choose Action > TCP Port Check and enter the ports, for example 443, 3389 or a range like 8000-8010, up to 1024 ports. PingTrace shows Open, Closed or no answer for each port, with the connect time and the service name.
WinTraceRoute runs a single traceroute and shows statistics for every hop. PingTrace runs ping and traceroute side by side and adds the continuous MTR mode, the TCP Port Check and all ping.exe options.
Yes. Click IPv4 or IPv6 to force one address family, or let PingTrace choose it from the addresses of the host.
Yes. The free 30-day trial runs on Windows 10 and 11 and on Windows 7, 8 and 8.1. A license is $19.95.
After a completed secure online order, an unlocking key file is emailed to you within two business days. Questions about ordering or registration: order@ashkon.com. Prices for all products are on the Order page.
Visual traceroute for Windows with min/avg/max RTT, packet loss and a latency graph per hop, plus host name, ASN and country of every router.
Website, server and uptime monitor: HTTP/HTTPS status, content changes, keywords, ping, TCP ports and DNS, with Windows notifications and TLS expiry warnings.
Lists every open TCP and UDP port and connection, IPv4 and IPv6, with the owning process, remote host name and network owner. A readable replacement for netstat.