Stock Sector Monitor - Track Stock Sector and Industry Performance

Stock Sector Monitor is a desktop financial application that monitors about 150 stock market industries and more than 5000 stocks. See the best and worst performers in each sector, watch quotes, percent change and volume, print reports, open news, charts and company profiles, and keep your own portfolios.

Download free trial Buy now – $49.95
Stock Sector Monitor – all market sectors at a glance: sector pie chart and sector performance ticker

Features

  • Explorer-style interface: stock groups and sectors on the left, sortable quote list on the right
  • 11 market sectors with 150 industries and 5000+ stocks
  • Market Overview: every sector and industry ranked by cap-weighted, equal-weighted and median % change, breadth, market cap and coverage
  • Your own groups: Watch List, Holdings and any number of custom portfolios
  • Quote, change, % change, open, high, low and volume with fast asynchronous updates; up/down/unchanged count in the status bar
  • Two real-time data feeds with automatic failover from free internet sources
  • Built-in interactive chart panel: 1m, 5m, 15m, 30m, 1h, daily, weekly and monthly bars; candlesticks, OHLC bars, lines and areas; ranges from 1 day to all history; log scale
  • Technical indicators (SMA, Bollinger Bands and more) and drawing tools: trend lines, channels, Fibonacci retracements and fans, shapes, with magnet and undo
  • One-click Overview, Forecast and Financials pages for the selected company; customizable URLs
  • Symbol auto-complete when adding companies; add, edit and delete companies and groups
  • Custom colors and fonts: light or dark panels to match your desktop
  • Print the quote list; export quotes and symbol lists as ASCII text
  • Remembers window layout, column widths, sort order and selected group

How to track stock sector performance on Windows

  1. Download and install the free 10-day trial of Stock Sector Monitor.
  2. Open Market Overview in the tree on the left. It shows all 11 sectors and their industries with cap-weighted, equal-weighted and median % change, stocks up and down, and the best and worst stock.
  3. Sort and drill down: click a column header to rank sectors or industries, and double-click an industry to open its list of stocks.
  4. Watch the quotes: the list shows price, change, % change, open, high, low and volume. Click Update on the toolbar (Tools > Update Quotes) to refresh them.
  5. Look closer: select a stock to see its chart in the chart panel, or click Overview, Forecast or Financials for its research pages.

When you need a stock sector tracker

  • Which sectors are leading today? Rank every sector and industry by % change at a glance.
  • Is a move broad or driven by a few giants? Compare the cap-weighted change with the equal-weighted and median change, and the count of stocks up and down.
  • The best and worst stocks in an industry: open the industry and sort its stocks by % change.
  • Finding the peers of a stock: every industry lists all of its stocks side by side.
  • Your own lists next to the market: Watch List, Holdings and any number of your own groups (File > New Group, then Edit > Add Company).
  • Quotes in a spreadsheet: File > Export Quotes saves the current list to a comma-separated file.

Want quotes in view all day? Stock Ticker Application Bar scrolls your stocks across the top of the screen. For full-size charts of many symbols, try CharTTool.
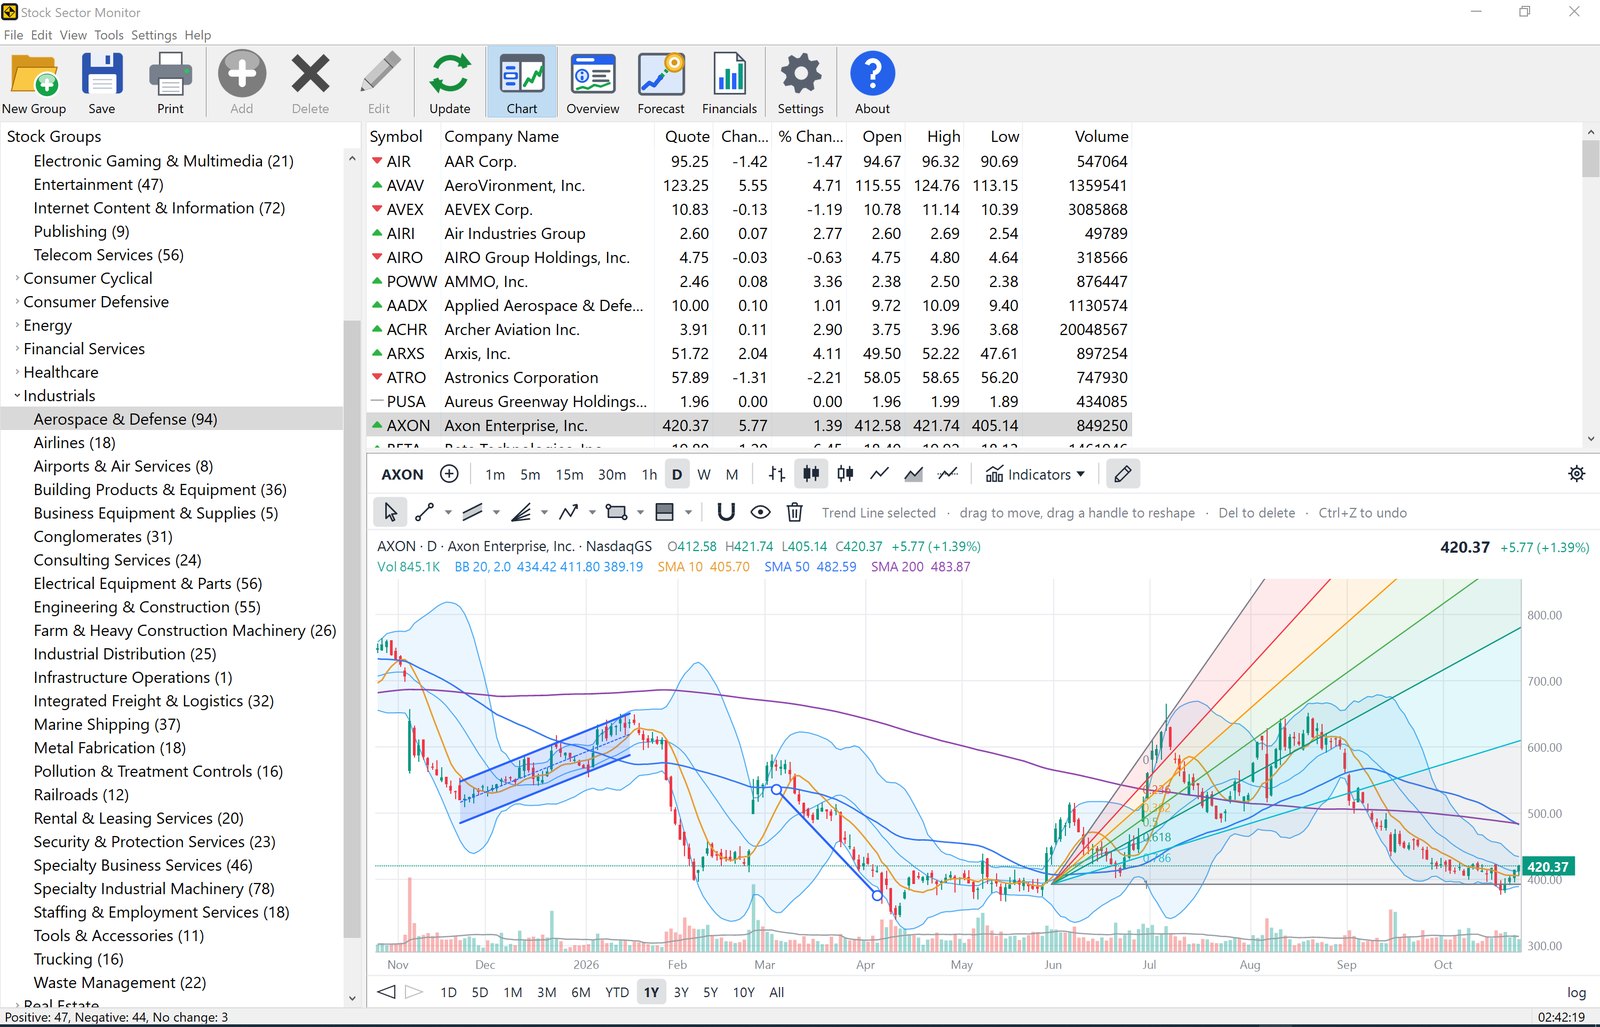
Stock Sector Monitor light theme: Industrials sector groups, Aerospace & Defense quotes and a daily chart with indicators and drawings
Light theme: sector quotes and chart with indicators and drawings
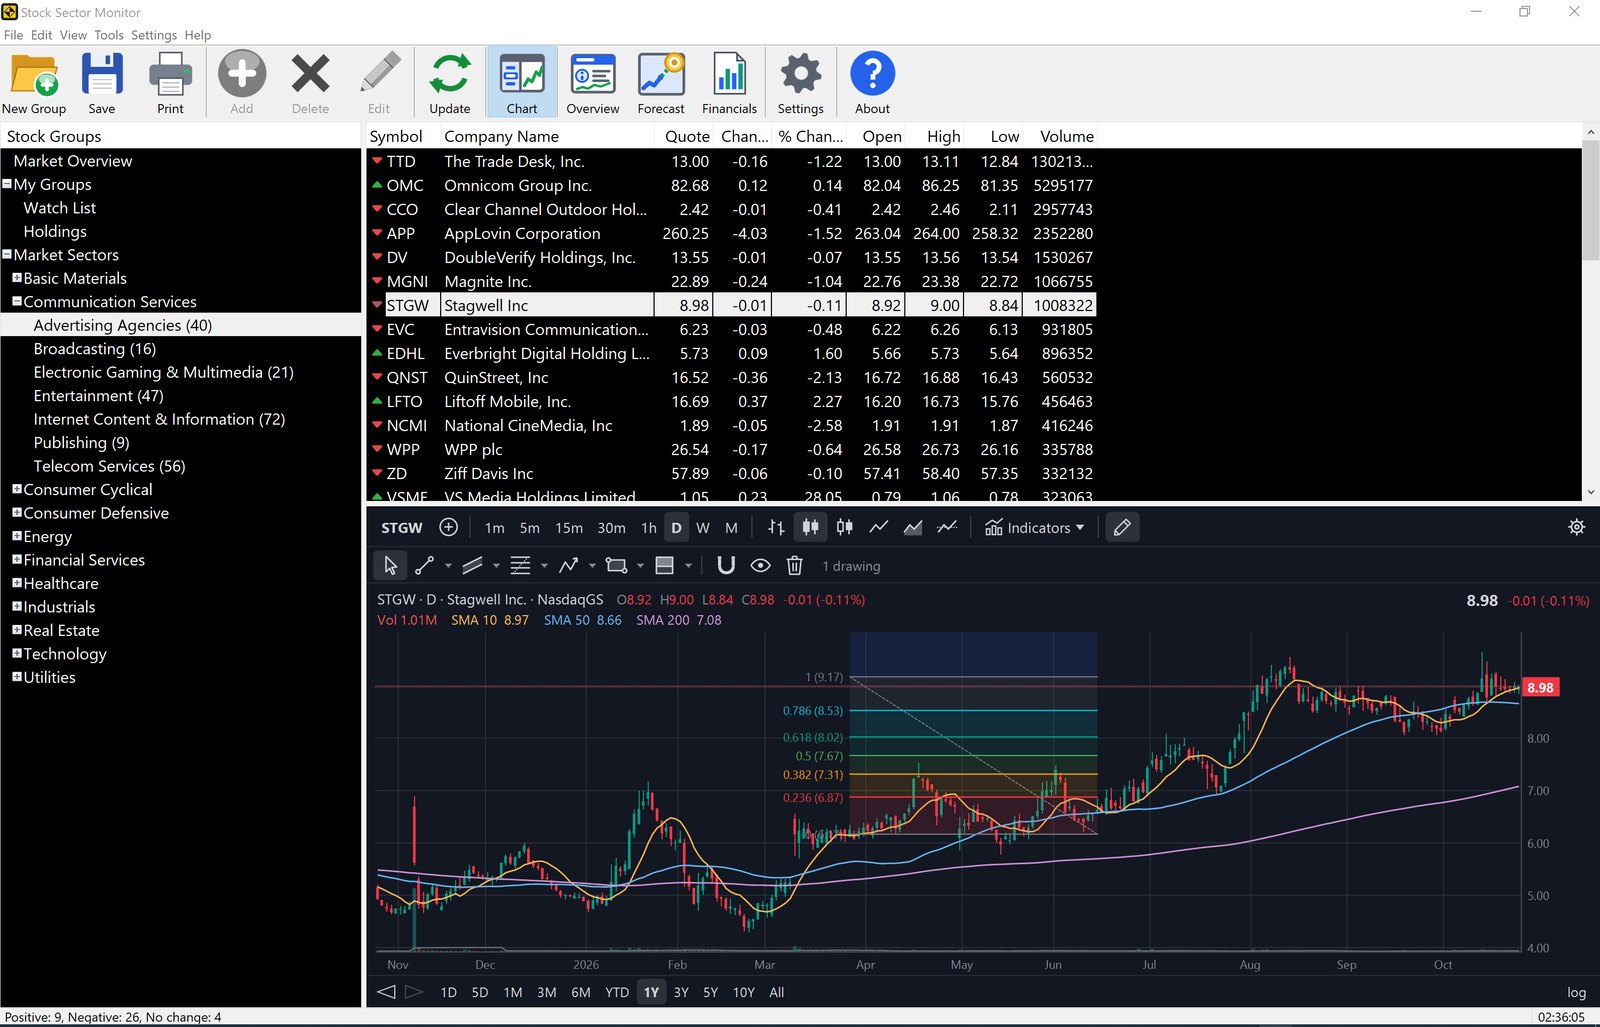
Stock Sector Monitor dark theme: Advertising Agencies quotes and a daily chart with Fibonacci retracement
Dark theme: Market Overview, My Groups and Fibonacci retracement

Explore sectors

Browse the sector lists online: Energy stocks, Agriculture stocks, Healthcare stocks and all stock sectors and industries.

Frequently asked questions

How can I see which stock market sectors are up today?

Open Market Overview. It lists all 11 sectors and their industries with cap-weighted, equal-weighted and median % change, the number of stocks up and down, and the best and worst stock. Click a column header to sort.

What is the difference between cap-weighted and equal-weighted % change?

Cap-weighted change gives large companies more weight, equal-weighted change counts every stock the same, and the median shows the typical stock. When they differ a lot, a few large stocks are driving the sector.

Can I create my own stock watch list?

Yes. My Groups holds a Watch List, Holdings and any number of your own groups. Type a symbol or company name to add a stock and pick it from the suggestions.

Does Stock Sector Monitor include stock charts?

Yes. The chart panel shows the selected stock with 1-minute to monthly bars, candlesticks, bars, lines or areas, technical indicators and drawing tools.

Where do the quotes come from?

From two real-time data feeds from free internet sources. In automatic mode the second feed takes over when the first one fails. The last quotes are kept, so the list still shows data when you are offline.

Does Stock Sector Monitor run on Windows 11?

Yes. It runs on Windows 7, 8, 8.1, 10 and 11, 32-bit and 64-bit.

Is there a free trial?

Yes. The free 10-day evaluation version lets you try it before you buy. A license is $49.95.

Ordering

After a completed secure online order, an unlocking key file is emailed to you within two business days. Questions about ordering or registration: order@ashkon.com. Prices for all products are on the Order page.