
Moving Averages Crossing
Buy when a shorter moving average crosses above a longer one; sell when it crosses back below.

Stock Predictor
Stock Predictor charts stocks with several technical indicators at once, keeps lists of securities and backtests your trading strategies. It has dozens of built-in technical indicators, 23 trading strategies and over 500 combinations. Apply a strategy to a stock with one click and see its cumulative and summarized performance for any period. Quotes are downloaded free – never pay for your charts again.
Download free trial Buy now – $295.00Each sample shows a strategy on a real chart, with buy (green) and sell (red) arrows where Stock Predictor generated the signals.
Buy when a shorter moving average crosses above a longer one; sell when it crosses back below.
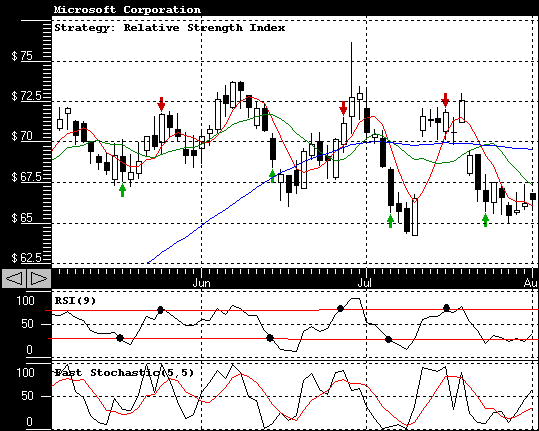
Buy when RSI falls below the oversold level; sell when it rises above the overbought level.

Buy when slow %K crosses above %D; sell when it crosses below.
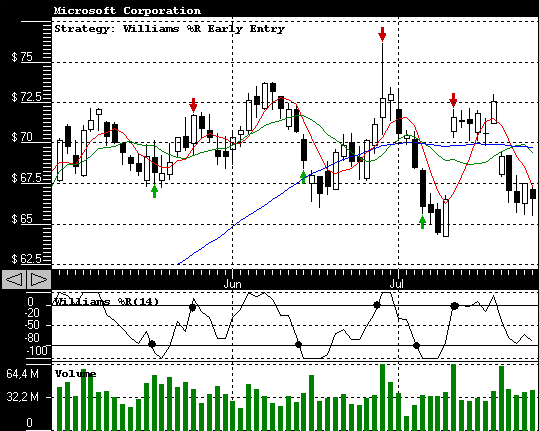
Buy when Williams %R falls into the oversold zone; sell when it reaches the overbought zone.
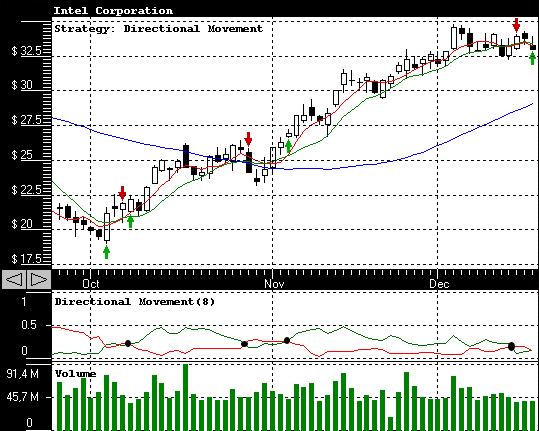
Buy when +DI crosses above −DI; sell when it crosses below.
More strategies – all 23 with their rules
Stock Predictor costs $295.00 for a single-user license. Pay securely online with PayPal; after the order is completed an unlocking key file is emailed to you within two business days. For multiple licenses or questions about registration, contact us. Prices for all products are on the order page.