
Sample trading strategy
Directional Movement
The chart shows the Directional Movement strategy on Intel with an 8-day DMI. A buy signal is generated when the positive directional indicator (+DI, green) crosses above the negative one (−DI, red) and a sell signal when +DI crosses below −DI.
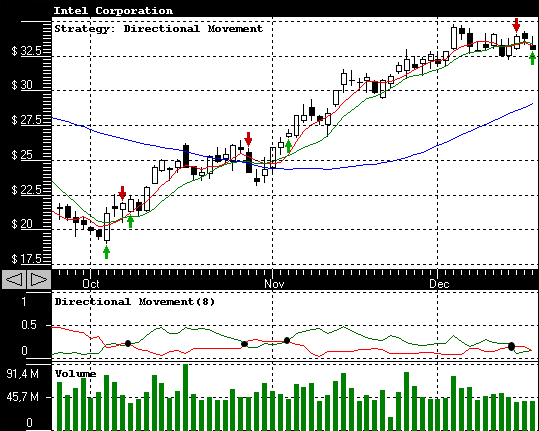
- Buy when +DI crosses above −DI.
- Sell when +DI crosses below −DI.
Full rules of the Directional Movement strategy
Backtest results describe past prices and do not guarantee future results. See our disclaimer.