
Sample trading strategy
Slow Stochastic Oscillator
The chart shows the Slow Stochastic Crossing strategy with Slow Stochastic(5,5). A buy is generated when %K (black) crosses above %D (red) and a sell when %K crosses below %D. When the stochastic lines cross, price momentum is changing direction. A more selective version also checks the level of the crossing – buys below 20 and sells above 80 – see Slow Stochastic Cross/Rising.
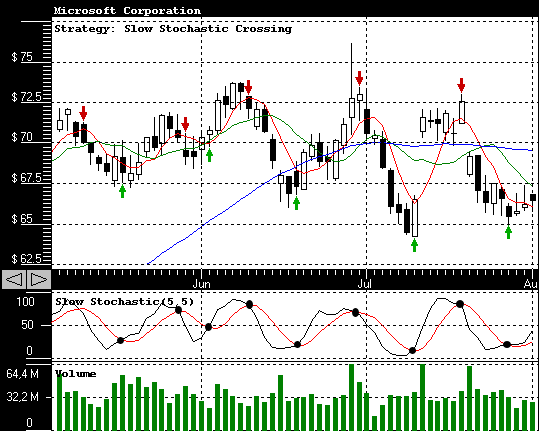
- Buy when %K crosses above %D.
- Sell when %K crosses below %D.
Full rules of the Slow Stochastic Crossing strategy
Backtest results describe past prices and do not guarantee future results. See our disclaimer.