
Sample trading strategy
Relative Strength Index
The chart shows the Relative Strength Index strategy with RSI(9). A buy signal is generated when RSI falls below the lower limit (30 in this example) and a sell signal when RSI reaches the upper limit (70). RSI measures the speed and size of recent price changes to show overbought and oversold conditions.
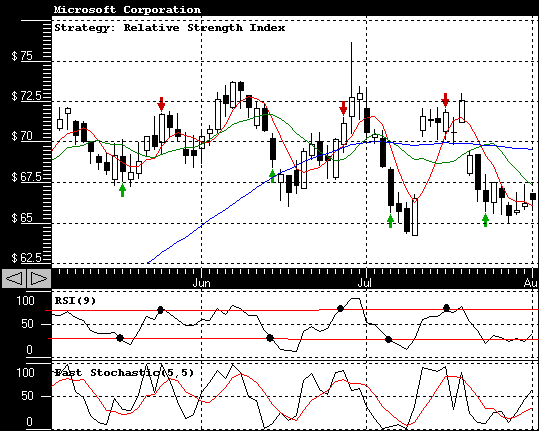
- Buy when RSI falls below the lower limit w.
- Sell when RSI rises above the upper limit v.
Full rules of the Relative Strength Index strategy
Backtest results describe past prices and do not guarantee future results. See our disclaimer.