
Sample trading strategy
Williams %R
The chart shows the Williams %R Early Entry strategy with Williams %R(14). Readings above −20 mean the stock is overbought and readings below −80 mean it is oversold. The strategy buys when %R falls below −80 and sells when it rises above −20.
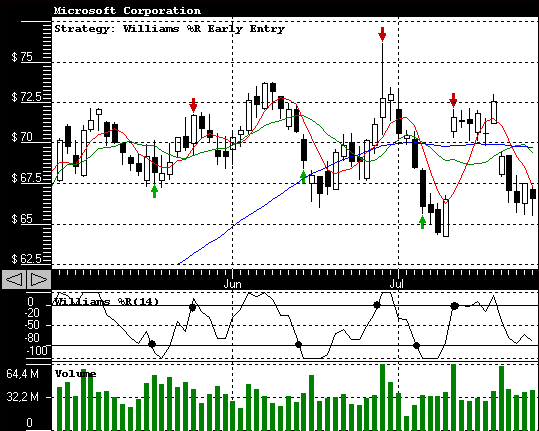
- Buy when Williams %R falls below w.
- Sell when Williams %R rises above v.
Full rules of the Williams %R Early Entry strategy
Backtest results describe past prices and do not guarantee future results. See our disclaimer.