
Stock Predictor feature
Manual Strategy Performance Analysis
Place buys and sells by hand, based on your own reading of the chart and indicators, and let Stock Predictor calculate how they performed.
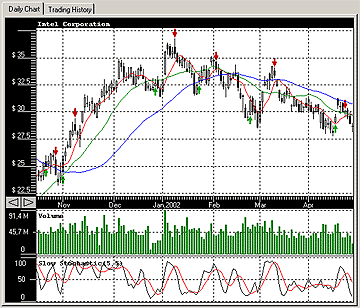
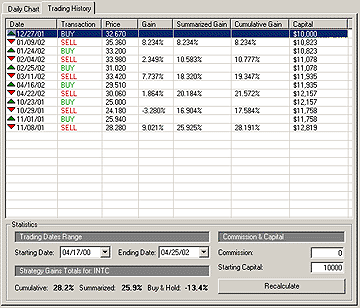
In this example the buys were placed on bullish Slow Stochastic crossings when %D was above 50, and the sells when %K crossed %D in a downward direction.
The Trading History tab lists each transaction with its gain, and the Statistics panel shows the cumulative and summarized performance against buy and hold for the selected date range, commission and starting capital.
Step-by-step instructions: Manual strategy analysis in the Stock Predictor guide.
Backtest results describe past prices and do not guarantee future results. See our disclaimer.