
Stock Predictor feature
Automated Strategy Performance Analysis
Run a trading strategy on a group of stocks over a selected period and get a performance report for every stock and for the group.
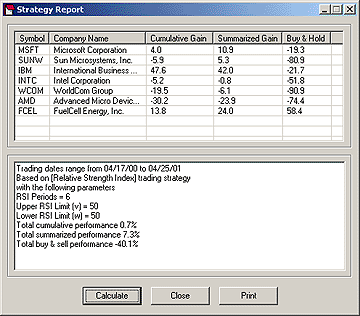
The sample report shows a strategy that buys when RSI(6) turns upward below 50 and sells when RSI(6) turns downward above 50. It was backtested on a group of stocks from 04/17/2000 to 04/25/2001 with zero commission.
Cumulative performance means all money from each sale is reinvested in the same stock. Summarized performance means a fixed sum is invested at each buy. Buy-and-hold results are shown for comparison.
Step-by-step instructions: Automated strategy analysis in the Stock Predictor guide.
Backtest results describe past prices and do not guarantee future results. See our disclaimer.