
CharTTool 3.9
CharTTool User Guide
This guide explains everything CharTTool can do: opening one chart or a whole list of them, chart styles, intervals and ranges, all 32 technical indicators with their formulas and default settings, the 26 drawing tools, comparing symbols, color schemes, printing, data sources and the keyboard shortcuts. To see the indicators and drawing tools on real charts, with a short technical analysis of each, visit the CharTTool Chart Gallery.
Contents
- What CharTTool does
- Installing, trial and registration
- The main window
- Opening charts and symbols
- Ticker lists and the Symbols list
- The chart window
- Intervals and ranges
- Chart styles, log scale, dividends and splits
- Zooming, panning and the crosshair
- Technical indicators
- Overlay indicators (on the price chart)
- Pane indicators (below the price chart)
- Drawing tools
- Comparing symbols
- The Settings dialog
- Color schemes
- Printing and copying charts
- Data sources, cache and offline use
- Keyboard and mouse reference
- Command line and where settings are kept
- Troubleshooting - questions and answers
- Registration and support
1. What CharTTool does
CharTTool is a stock charting program for Windows. It downloads historical and intraday quotes from free internet sources and draws them as interactive charts – one chart window per symbol, as many windows as you like. Each chart can have its own interval, range, style, indicators and colors, and you can draw trend lines, channels, Fibonacci tools and patterns on it.
It charts US and international stocks, ETFs, mutual funds, market indices, futures and currency pairs. It is built for quickly scanning many charts: open a list of 30 or 100 symbols and step through them with one key.
2. Installing, trial and registration
Download charttool.exe and run it. Setup installs CharTTool
into C:\Program Files (x86)\Ashkon Software\CharTTool with Start menu shortcuts, and
can also:
- put a CharTTool icon on the desktop;
- associate ticker lists (
*.tlffiles) with CharTTool, so double-clicking a list opens its charts.
Three sample ticker lists – DOW-JONES, Large Cap and My Stocks – are
copied to Documents\Ashkon Software\CharTTool. Setup needs administrator rights;
CharTTool itself runs as a normal user.
Evaluation (trial) version
CharTTool can be evaluated free of charge for 30 days, with every feature working. Each time an unregistered copy starts, a short dialog shows how many days are left, with three buttons:
- Register opens the CharTTool order page;
- Continue starts CharTTool (available during the 30-day evaluation);
- Quit closes the program.
After you order, you receive a key file that turns the trial into the full version and the dialog no longer appears. Help > About CharTTool shows the version and the name the copy is registered to.
Upgrading from CharTTool 2.x
Version 3 is a new program and installs over the old one. Your old ticker lists open unchanged. Version 2.x settings are not used; the new defaults are described in this guide.
Uninstalling
Use Settings > Apps (or Control Panel > Programs and Features). Your ticker lists in the Documents folder are kept.
3. The main window
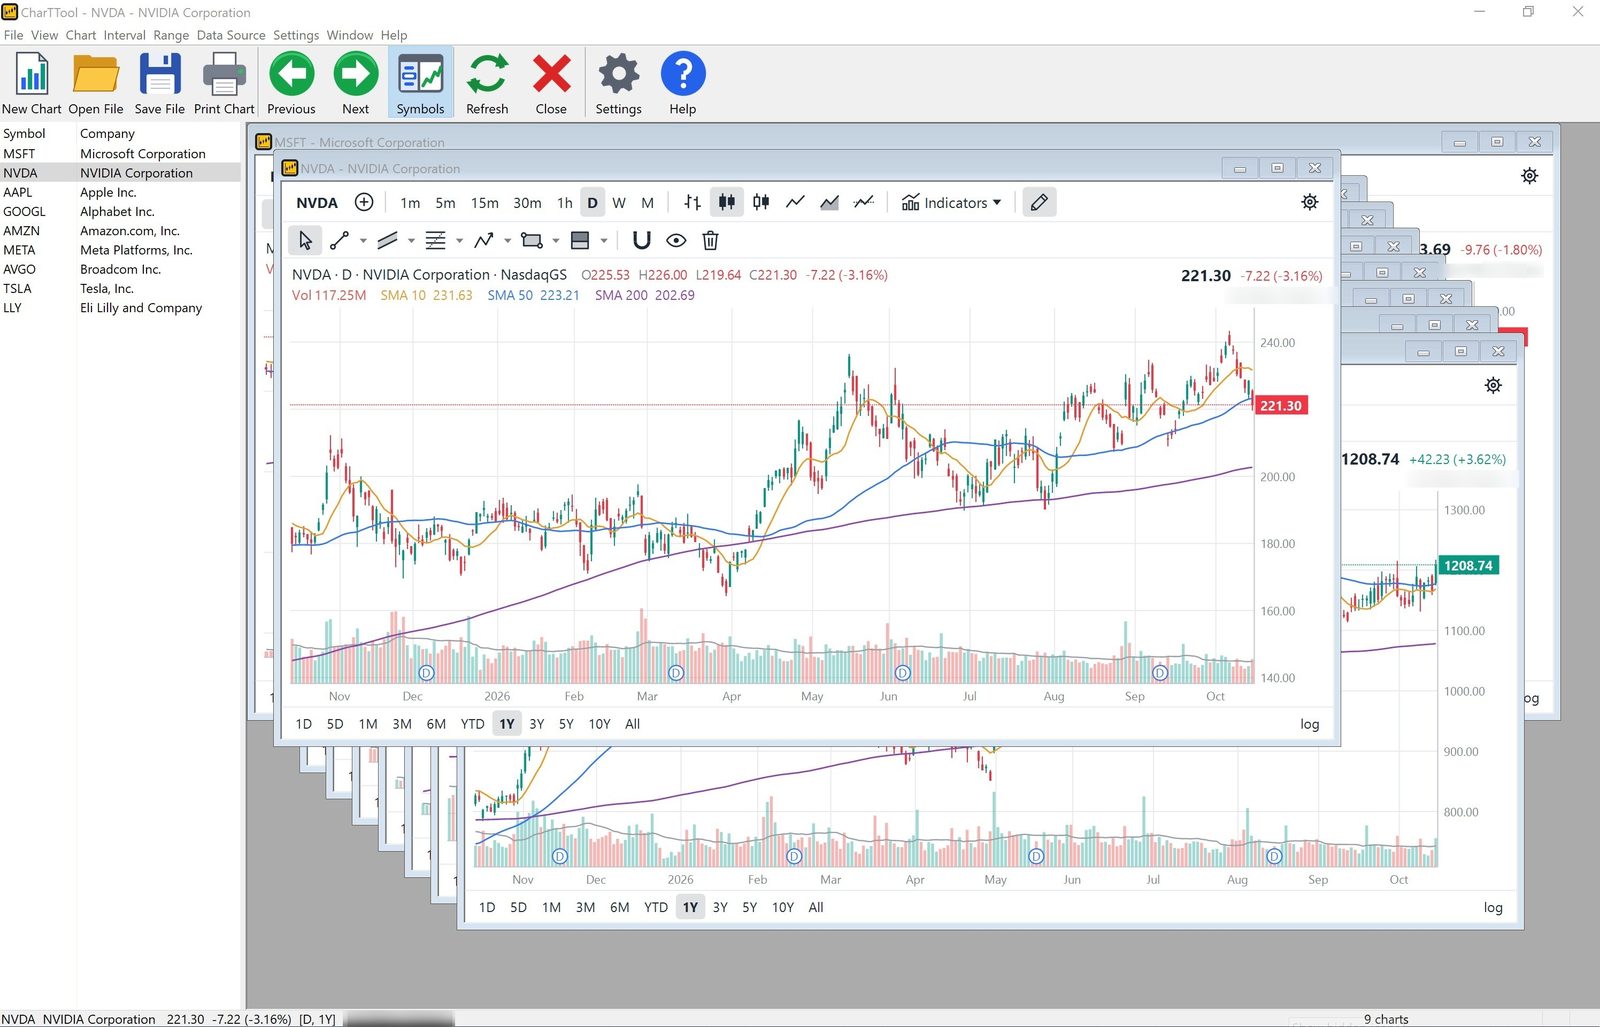
The main window holds the menu, a toolbar with large buttons, the optional Symbols list on the left, the chart windows and the status bar.
| Toolbar button | What it does |
|---|---|
| New Chart | Opens charts for one or more symbols you type (Ctrl+N). |
| Open File | Opens a ticker list and charts every symbol in it (Ctrl+O). |
| Save File | Saves the symbols of all open charts as a ticker list (Ctrl+S). |
| Print Chart | Prints the active chart (Ctrl+P). |
| Previous / Next | Brings the previous or next chart to the front, in list order. |
| Symbols | Shows or hides the Symbols list (the button looks pressed while the list is shown). |
| Refresh | Downloads fresh quotes for the active chart (F5). |
| Close | Closes the active chart (Ctrl+W). |
| Settings | Opens Default Chart Settings – what every new chart starts with. |
| Help | Opens this guide (F1). |
The menus are File, View, Chart, Interval, Range, Data Source, Settings, Window and Help. The Chart, Interval and Range menus act on the active chart.
The status bar shows the active chart's symbol, company name, last price and change, interval and range on the left, and the number of open charts and downloads in progress on the right. Window captions show the symbol and company name, for example MSFT - Microsoft Corporation.
Under View you can turn the toolbar, status bar, drawing toolbar and Symbols list on or off, and set two options:
- Open Charts Maximized – every chart fills the window, so Next and Previous work like a slideshow;
- Reopen Charts on Startup – restores the last layout (see section 5).
The Window menu has Cascade, Tile, Arrange Icons and Close All Charts.
4. Opening charts and symbols
Click New Chart and type one symbol or many, separated by spaces or commas:
MSFT, NVDA AAPL ^GSPC. Each symbol opens in its own chart window. Symbols follow the usual
internet quote conventions:
| Security | Examples |
|---|---|
| US stocks and ETFs | MSFT, BRK-B, SPY, QQQ |
| Mutual funds | VFIAX, FXAIX |
| Indices | ^GSPC (S&P 500), ^DJI (Dow Jones Industrial), ^IXIC (Nasdaq Composite), ^VIX |
| Futures | CL=F (crude oil), GC=F (gold), ES=F (S&P 500 e-mini) |
| Currencies | EURUSD=X, JPY=X |
| International stocks | symbol plus exchange suffix: SHEL.L (London), SAP.DE (Xetra), RY.TO (Toronto) |
To change the symbol of an existing chart, click the symbol at the left of the chart's panel, or use Chart > Change Symbol. Look up stock symbols on our stock sectors and stock indices pages.
5. Ticker lists and the Symbols list
Ticker lists (.tlf files)
A ticker list is a plain text file with one symbol per line. File > Open Ticker List
(Ctrl+O) opens a chart for every symbol in the list; you can also drag a list onto the
CharTTool window, pick it from the recent-files list, or double-click it in Explorer.
File > Save Ticker List (Ctrl+S) saves the symbols of all open charts in
their current order. Lists are kept in Documents\Ashkon Software\CharTTool by default,
and can be edited in Notepad.
Moving between charts
Next (PgDn or Space) and Previous (PgUp or Shift+Space) walk through the charts in the order they were opened. With View > Open Charts Maximized this is the fastest way to review a list of stocks.
The Symbols list
Click Symbols on the toolbar (or View > Symbol List) to show a list docked on the left of the main window, with one row per open chart: symbol and company name.
- Click a row to bring that chart to the front; double-click to also move the keyboard focus to the chart.
- Up/Down, Home/End, or typing a symbol moves the selection and shows that chart, while the focus stays in the list so you can keep browsing.
- Del closes the highlighted chart and highlights the next one – press it repeatedly to weed out a list, then save what is left as a new ticker list.
- The selection always follows the active chart. Drag the right edge of the list to resize it; its width and visibility are remembered.
Layout saved between sessions
When you close CharTTool, every open chart is saved: its symbol, all its settings (interval, range, style, indicators, parameters and colors), its comparison symbols and its window position. The active chart, the maximized state and the toolbar and status bar visibility are saved too. With View > Reopen Charts on Startup checked, the same layout comes back next time. Opening a list or giving symbols on the command line starts with those instead.
6. The chart window
Every chart window has the same layout:
- Top panel: the symbol (click to change it), ⊕ to compare with another symbol, the interval buttons 1m 5m 15m 30m 1h D W M, six chart-style icons, the Indicators ▾ menu, the ✎ pencil that shows or hides the drawing toolbar, and ⚙ on the right for this chart's settings.
- Drawing toolbar (second row, optional): see section 13.
- Header: symbol, interval, company name and exchange, then open, high, low, close and change of the bar under the crosshair (or the last bar). The second line is the legend – the name, settings and current value of every indicator on the price chart. At the right: last price and change.
- Price chart with the price axis on the right and a colored tag showing the last price.
- Indicator panes below the price chart, one per pane indicator, each with its own legend and scale.
- Bottom bar: the ranges 1D 5D 1M 3M 6M YTD 1Y 3Y 5Y 10Y All, and the log switch on the right.
Buttons on the panel change this chart only. To change every chart at once, use the Interval and Range menus with Apply Interval/Range to All Charts checked, or the Apply to All Charts button of the Settings dialog.
Right-click anywhere in a chart for a menu with Interval, Range, Chart Style, Indicators, Logarithmic Scale, Dividends & Splits, Refresh and Print Chart.
7. Intervals and ranges
The interval is the time each bar or candle covers; the range is how much history the chart shows. Picking a range also picks its usual interval:
| Range | Interval selected | Shortcut |
|---|---|---|
| 1 Day | 5 minutes | Ctrl+1 |
| 5 Days | 15 minutes | Ctrl+2 |
| 1 Month | 30 minutes | Ctrl+3 |
| 3 Months | 1 hour | Ctrl+4 |
| 6 Months, Year to Date, 1 Year, 3 Years | 1 day | Ctrl+5 to Ctrl+8 |
| 5 Years, 10 Years | 1 week | Ctrl+9 (5 Years) |
| All Dates | 1 month | Ctrl+0 |
Picking an interval afterwards keeps the range when possible. Intraday history is limited by the free data sources: 1-minute bars cover at most 7 days, 5 to 30-minute bars 60 days and 1-hour bars 2 years; a longer range is shortened to fit. Intraday times are shown in the exchange's local time.
When a chart is first loaded, CharTTool downloads some extra history before the visible range, so indicators such as the 200-day moving average are already valid at the left edge of the chart.
8. Chart styles, log scale, dividends and splits
| Style | Description |
|---|---|
| Bars | OHLC bars: a vertical line from low to high, a tick to the left for the open and to the right for the close. |
| Candles | Japanese candlesticks; the body runs from open to close and is filled in the up color when the close is higher than the open, in the down color otherwise. |
| Hollow Candles | Candles with an empty body when the close is above the open; the color shows whether the close is above or below the previous close. |
| Line | A line through the closing prices. |
| Area | The close line with the area below it shaded. |
| Baseline | The close line shaded in the up color above, and in the down color below, the first close of the visible range – gains and losses for the period at a glance. |
Logarithmic scale (the log switch, or Chart > Logarithmic Scale) spaces prices by percentage, so a move from 10 to 20 takes the same height as 100 to 200. Use it for long ranges and fast-growing stocks.
Dividends & Splits marks each dividend with a D circle and each stock split with an S circle at the bottom of the price chart, under the bar where it occurred. Markers are shown on daily, weekly and monthly charts.
9. Zooming, panning and the crosshair
- Zoom: mouse wheel, or + and -.
- Pan: drag the chart with the mouse, or press ← and →.
- Reset: Home or a double-click on an empty part of the chart shows the full range again.
- Crosshair: moving the mouse over the chart shows a crosshair with the date and price on the axes; the header and every legend show the values of the bar under it.
- Refresh: F5 refreshes this chart, Ctrl+F5 all charts.
10. Technical indicators
CharTTool has 32 technical indicators. Overlays are drawn on the price chart, in the price's units; pane indicators get their own pane below the chart. Turn indicators on and off with the Indicators ▾ button on the chart panel, the right-click menu or Chart > Indicators. The menu is grouped; a group's caption shows how many of its indicators are on, for example Moving Averages (2):
| Menu entry | Indicators |
|---|---|
| Volume | Volume bars with a moving average |
| Moving Averages ▸ | SMA 1, SMA 2, SMA 3, EMA 1, EMA 2, WMA, Hull MA, VWAP |
| Bands & Channels ▸ | Bollinger Bands, Keltner Channels, Donchian Channels |
| Trend Overlays ▸ | Ichimoku Cloud, Parabolic SAR, SuperTrend |
| Pivot Points | Classic, Fibonacci or Camarilla pivot levels |
| RSI, MACD | Relative Strength Index; Moving Average Convergence/Divergence |
| Stochastics ▸ | Stochastic Fast, Stochastic Slow, Stochastic RSI |
| Oscillators ▸ | Williams %R, CCI, MFI, Rate of Change, Momentum |
| Trend Strength ▸ | ADX / DMI, Aroon |
| ATR | Average True Range |
| Volume Flow ▸ | OBV, Chaikin Money Flow, A/D Line |
Periods, multipliers and colors are changed on the Overlays and Panes tabs of the Settings dialog (section 15), either for one chart or as the default for new charts. A new chart starts with Volume and the 10, 50 and 200-period simple moving averages.
In the formulas below, n is the period, H, L, C and V are a bar's high, low, close and volume, and hlc3 is the typical price (H + L + C) / 3. Wilder's smoothing (RMA) is an exponential average with weight 1/n. The calculations follow the standard published definitions, so values match other major charting packages. For background on the classic indicators, see our technical analysis articles.
11. Overlay indicators (on the price chart)
Volume
Volume bars at the bottom of the price chart, in the up and down colors, with a moving average of volume (default 20; 0 turns it off). Volume is shown in K, M or B. Rising prices on rising volume confirm a trend; a breakout on low volume is suspect. More: Volume.
Moving averages
| Indicator | Default | Calculation |
|---|---|---|
| SMA 1, 2, 3 | 10, 50, 200 | Simple moving average: the mean of the last n closes. |
| EMA 1, 2 | 9, 21 | Exponential moving average with weight 2 / (n + 1); reacts faster than an SMA of the same length. |
| WMA | 20 | Weighted moving average: the latest close has weight n, the one before n − 1, and so on. |
| Hull MA | 20 | WMA(2 × WMA(C, n/2) − WMA(C, n), √n) – a smooth average with very little lag. |
| VWAP | – | Volume-weighted average price: Σ(hlc3 × V) / ΣV, restarted at the beginning of each trading day. Use it on intraday charts; institutional traders treat it as the day's fair price. |
Typical uses: the 50 and 200-day SMAs show the medium and long-term trend, and a 50-day SMA crossing above the 200-day (a golden cross) or below it (a death cross) is widely watched. Short EMAs such as 9 and 21 are used for crossover signals and as dynamic support. More: Moving Averages.
Bands and channels
| Indicator | Default | Calculation |
|---|---|---|
| Bollinger Bands | 20, 2 | Middle: SMA(C, n). Upper and lower: middle ± 2 standard deviations of the closes. The bands widen when volatility rises and tighten (a squeeze) before big moves. |
| Keltner Channels | 20, 2, ATR 10 | Middle: EMA(C, 20). Upper and lower: middle ± 2 × ATR(10). Closes outside the channel signal a strong trend. |
| Donchian Channels | 20 | Upper: highest high of the last n bars; lower: lowest low; middle: their average. The classic breakout channel of the “Turtle” traders. |
The area between the bands is shaded. More: Bollinger Bands, Envelopes.
Trend overlays
Ichimoku Cloud (Tenkan 9, Kijun 26, Span B 52). Conversion line (Tenkan-sen) = midpoint of the 9-bar high and low; base line (Kijun-sen) = midpoint of the 26-bar high and low; leading span A = average of the two; leading span B = midpoint of the 52-bar high and low. The two spans form the cloud, plotted 25 bars ahead (Kijun − 1), so CharTTool leaves empty space on the right when the latest bar is shown. The lagging span is the close plotted 25 bars back. The cloud is green while span A is above span B and red otherwise. Price above the cloud is read as an uptrend, below it as a downtrend, and the cloud itself as a support or resistance zone.
Parabolic SAR (step 0.02, maximum 0.2). Dots below the price in an uptrend and above it in a downtrend. The stop moves toward the price by an acceleration factor that starts at the step, grows by the step at every new extreme and stops at the maximum; when the price crosses the dots, the trend flips. Traders use the dots as a trailing stop.
SuperTrend (ATR 10, factor 3). A line at hlc2 − 3 × ATR below the price in an uptrend, or hlc2 + 3 × ATR above it in a downtrend (hlc2 = (H + L) / 2). The line only moves in the direction of the trend, and a close through it reverses the trend. Green in an uptrend, red in a downtrend.
Pivot Points
Support and resistance levels for the current period, calculated from the previous period's high (H), low (L) and close (C). P = (H + L + C) / 3.
| Type | Levels |
|---|---|
| Classic | R1 = 2P − L, S1 = 2P − H, R2 = P + (H − L), S2 = P − (H − L), R3 = P + 2(H − L), S3 = P − 2(H − L) |
| Fibonacci | R/S 1, 2, 3 = P ± 0.382, 0.618 and 1.000 × (H − L) |
| Camarilla | R/S 1–4 = C ± 1.1 × (H − L) / 12, / 6, / 4 and / 2 |
The period can be Day, Week, Month, Year or Auto. Auto uses daily pivots on 1 to 15-minute charts, weekly pivots on 30-minute and 1-hour charts, monthly pivots on daily charts and yearly pivots on weekly and monthly charts. Pivot lines are clipped to the price chart and do not change its scale.
12. Pane indicators (below the price chart)
RSI and MACD
RSI – Relative Strength Index (14, levels 70 and 30). RSI = 100 − 100 / (1 + RS), where RS is Wilder's average of up-closes divided by Wilder's average of down-closes over n bars. It moves between 0 and 100; above 70 is considered overbought, below 30 oversold, and divergences between RSI and price often warn of a reversal. The upper and lower levels can be changed. More: RSI.
MACD (12, 26, 9). MACD line = EMA(C, 12) − EMA(C, 26); signal line = EMA(MACD, 9); histogram = MACD − signal. The histogram is shaded by momentum: darker while it grows, lighter while it shrinks. MACD crossing its signal line, or crossing zero, are common buy and sell signals. More: MACD, Price Oscillator.
Stochastics
| Indicator | Default | Calculation |
|---|---|---|
| Stochastic Fast | %K 14, %D 3 | %K = 100 × (C − lowest low) / (highest high − lowest low) over 14 bars; %D = SMA(%K, 3). |
| Stochastic Slow | %K 14, %D 3, smooth 3 | The fast %K smoothed with a 3-bar SMA becomes the slow %K; %D = SMA(slow %K, 3). Fewer false signals than the fast version. |
| Stochastic RSI | length 14, %K 3, %D 3 | The stochastic formula applied to RSI(14) instead of price over 14 bars, then %K = SMA(3) and %D = SMA(%K, 3). Very sensitive; often used for timing entries within a trend. |
Readings above 80 are overbought and below 20 oversold; %K crossing %D is the usual signal. More: Fast Stochastic, Slow Stochastic.
Oscillators
| Indicator | Default | Calculation and use |
|---|---|---|
| Williams %R | 14 | −100 × (highest high − C) / (highest high − lowest low). Runs from 0 to −100; above −20 is overbought, below −80 oversold. More: Williams %R. |
| CCI – Commodity Channel Index | 20 | (hlc3 − SMA(hlc3, 20)) / (0.015 × mean deviation). Values above +100 show unusual strength, below −100 unusual weakness. |
| MFI – Money Flow Index | 14 | A volume-weighted RSI: money flow = hlc3 × V, split into positive and negative by whether hlc3 rose or fell; MFI = 100 − 100 / (1 + positive / negative). Above 80 overbought, below 20 oversold. |
| Rate of Change | 9 | 100 × (C − Cn bars ago) / Cn bars ago – the percent change over n bars. |
| Momentum | 10 | C − Cn bars ago – the price change over n bars. Crossing zero shows a change of direction. |
Trend strength
ADX / DMI (DI 14, ADX 14). +DM and −DM are the parts of today's range above yesterday's high and below yesterday's low. +DI and −DI = 100 × Wilder's average of +DM and −DM divided by ATR. ADX is Wilder's average of 100 × |+DI − −DI| / (+DI + −DI). Three lines are drawn: ADX, +DI and −DI. ADX above 25 shows a trending market (whatever its direction), below 20 a range; +DI above −DI favors the bulls.
Aroon (14). Aroon Up = 100 × (14 − bars since the 14-bar high) / 14; Aroon Down the same for the low. Up near 100 with Down near 0 shows a strong uptrend; the lines crossing signals a new trend.
ATR – Average True Range
ATR (14) is Wilder's average of the true range: the largest of H − L, |H − previous C| and |L − previous C|. It measures volatility in price units and is used to size positions and to place stops, for example 2 × ATR below the entry.
Volume flow
| Indicator | Default | Calculation and use |
|---|---|---|
| OBV – On Balance Volume | – | A running total that adds the volume on up-closes and subtracts it on down-closes. OBV rising ahead of the price suggests accumulation. More: On Balance Volume. |
| Chaikin Money Flow | 20 | Σ(MFM × V) / ΣV over 20 bars, where the money flow multiplier MFM = ((C − L) − (H − C)) / (H − L). Above zero shows buying pressure, below zero selling pressure. |
| A/D Line – Accumulation/Distribution | – | A running total of MFM × V. Divergences from price show accumulation or distribution. More: Accumulation/Distribution. |
OBV and A/D are cumulative, so only their direction matters, not their level; values are shown in K, M or B.
13. Drawing tools
The drawing toolbar
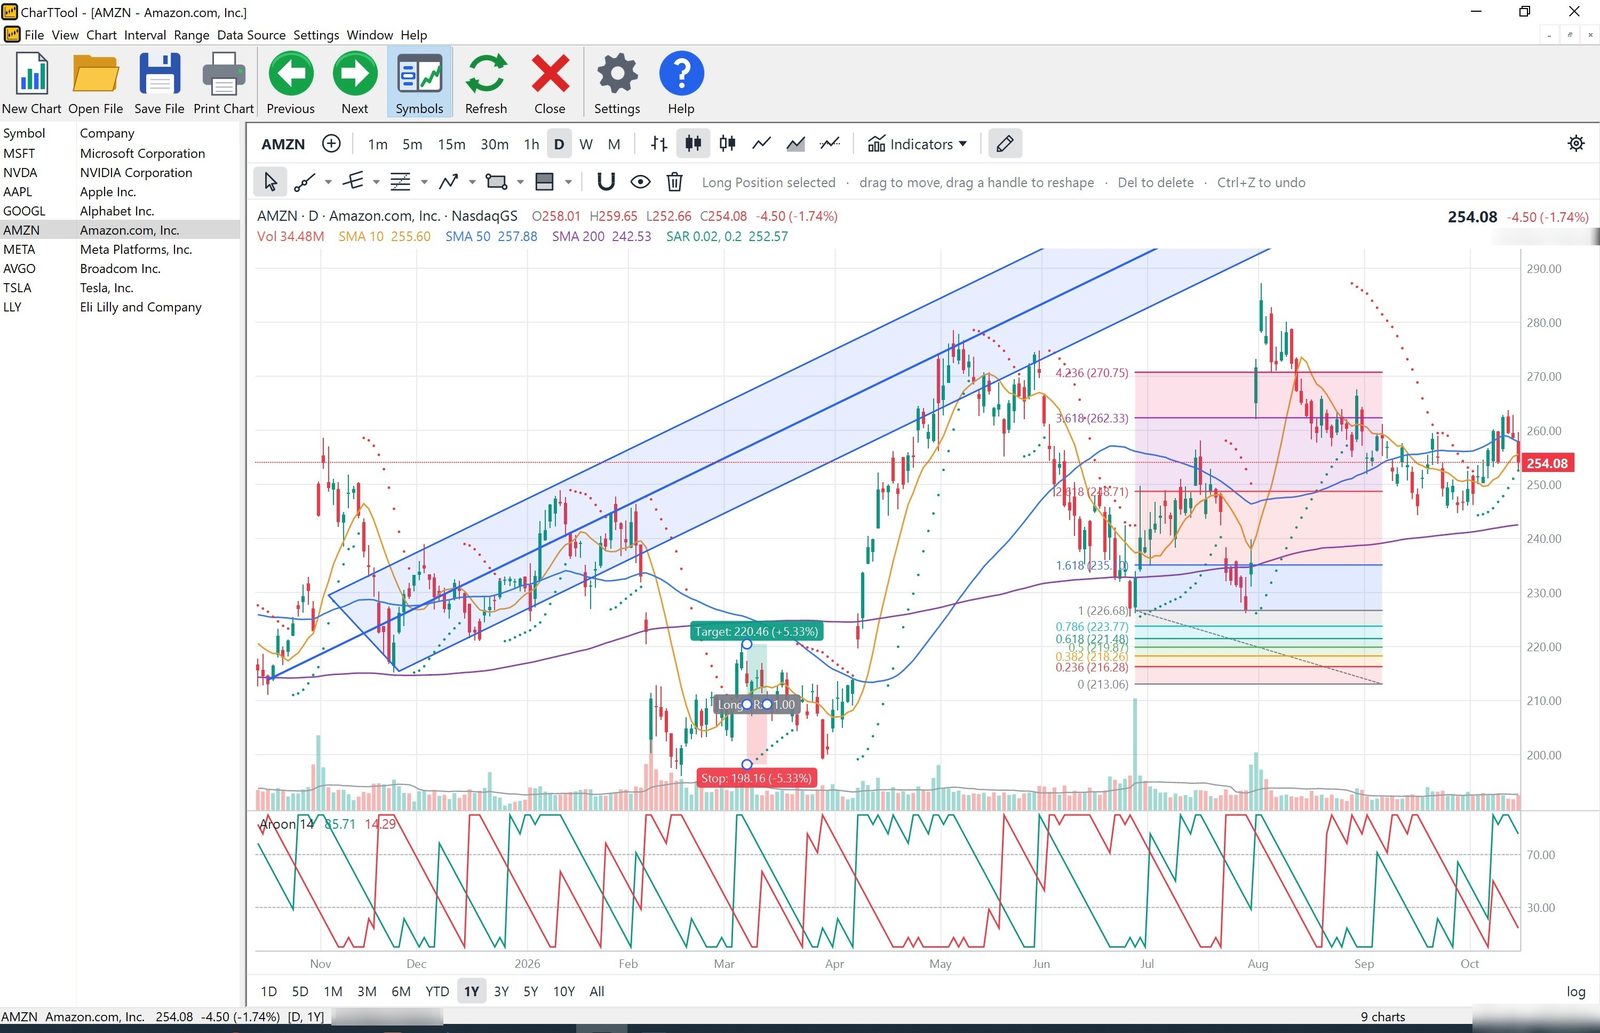
Click the ✎ pencil on the chart panel, or View > Drawing Toolbar, to show the drawing tools as a second row in every chart. With the row hidden, existing drawings stay visible and can still be selected, moved and deleted. The row has the cursor, six group buttons, then magnet, hide drawings (eye) and remove all (trash). Each group button shows the tool of that group you used last – click it to use that tool again, or click its small ▾ arrow for every tool in the group. A hint at the right of the row tells you what to click next.
| Group | Tools |
|---|---|
| Lines | Trend Line, Ray, Extended Line, Horizontal Line, Horizontal Ray, Vertical Line |
| Channels & Pitchforks | Parallel Channel, Regression Channel, Andrews' Pitchfork, Schiff Pitchfork, Modified Schiff Pitchfork |
| Fibonacci | Fib Retracement, Fib Extension, Fib Time Zones, Fib Fan, Fib Arcs |
| Patterns | Path, Impulse Wave (1-5), Corrective Wave (ABC), XABCD Pattern |
| Shapes & Notes | Rectangle, Text, Arrow Up, Arrow Down |
| Positions | Long Position, Short Position |
Placing a drawing
Pick a tool and click its points on the chart (click, move, click). Two-point tools can also be drawn by pressing and dragging. After placing, the tool returns to the cursor and the new drawing stays selected. Esc drops the shape being placed, a second Esc drops the tool; a right-click also cancels.
| Clicks | Tools |
|---|---|
| 1 | Horizontal Line, Horizontal Ray, Vertical Line, Text, Arrow Up, Arrow Down |
| 2 | Trend Line, Ray, Extended Line, Rectangle, Fib Retracement, Fib Time Zones, Fib Fan, Fib Arcs, Regression Channel, Long and Short Position |
| 3 | Fib Extension, the three pitchforks, Parallel Channel (base line, then width) |
| 4 / 5 / 6 | Corrective Wave (A-B-C), XABCD Pattern, Impulse Wave (0-1-2-3-4-5) |
| any (up to 64) | Path – double-click, Enter or right-click to finish |
What each tool draws
- Trend Line, Ray, Extended Line: a line between two points, from the first point through the second to the chart edge, or across the whole chart.
- Horizontal Line / Ray: a price level with its price tagged on the axis. Vertical Line: a date, tagged at the bottom of the price chart.
- Parallel Channel: a base line and a parallel line through the third click, with a shaded band and a dashed middle line.
- Regression Channel: the least-squares line through the closes between the two clicked bars, with bands at ±2 standard deviations of the residuals.
- Pitchforks: click the pivot, then two swings. The median line runs from the start point through the midpoint of the two swings, with parallel lines through the swings. Andrews starts at the pivot; Schiff starts halfway between the pivot and the first swing in price; Modified Schiff starts at the midpoint of the pivot and first swing in both time and price.
- Fib Retracement: levels 0, 0.236, 0.382, 0.5, 0.618, 0.786, 1, 1.618, 2.618, 3.618 and 4.236 with shaded bands and price labels. Level 1 is at the first point and 0 at the second: draw from the swing low to the swing high (or high to low) and read the retracements back from 0.
- Fib Extension (trend-based): A–B is the move, C the end of the pullback; levels at C + (B − A) × 0, 0.618, 1, 1.272, 1.618 and 2.618 project possible targets.
- Fib Time Zones: the second click sets the unit; vertical lines at 0, 1, 2, 3, 5, 8, 13, 21… units mark possible turning points in time.
- Fib Fan: rays from the first point through the retracement levels at the second point's time. Fib Arcs: half circles around the second point at 0.236 to 1 of the distance from the first point. Arcs are circles on the screen, so their price levels change when the price scale changes.
- Impulse Wave, Corrective Wave: Elliott wave counts as a connected line labeled 1–5 or A–B–C, labels above peaks and below troughs. XABCD Pattern: a harmonic pattern (Gartley, Bat, Butterfly…) with the XAB and BCD triangles shaded and the AB/XA, BC/AB, CD/BC and AD/XA ratios on dashed legs. Path: a free polyline.
- Rectangle: a shaded price/time zone. Text: click where the note goes and type it (several lines are fine); double-click a note or right-click > Edit Text to change it. Arrow Up / Down: green buy and red sell markers whose tip points at the click.
- Long / Short Position: click the entry, then the target, which also sets the end time. The stop starts at the same distance as the target (1:1) and is moved with its handle at the left edge; if the second click is on the losing side it becomes the stop and the target mirrors it. Labels show the target and stop with their percent moves and the reward/risk ratio.
Editing drawings
- Click a drawing to select it; its handles appear. Drag the body to move it (in whole bars), drag a handle to reshape it.
- Del removes the selected drawing; right-click a drawing and choose Remove does the same. Ctrl+Z undoes the last change to a drawing (up to 50 steps). Esc during a drag puts the drawing back.
- Magnet: when on, points snap to the nearest open, high, low or close of the bar; holding Ctrl reverses the magnet while you place or drag. Time always snaps to whole bars, including bars past the last one, so lines can be extended into the future.
- Hide Drawings and Remove All Drawings are also on the Chart menu.
Where drawings are kept
Each point is stored as a date/time and a price, so drawings stay in place when you zoom, pan or change the interval and range. Drawings belong to the symbol: every chart window showing AXP shows the same drawings, and they come back the next time you open AXP. They are printed and copied with the chart. While symbols are being compared (percent scale) drawings are hidden.
14. Comparing symbols
Click ⊕ next to the symbol on the chart panel, or choose Chart > Compare With, and type one or more
symbols, for example ^GSPC QQQ. Up to six symbols can be added to a chart. The chart switches to a
percent scale: every line starts at 0% at the left edge of the visible range and shows the gain or loss
from there, so a stock's performance can be measured against other stocks, its sector ETF or an index.
Each symbol has its own color and its own entry in the legend. Zooming or panning re-bases all lines to the new left edge. Indicators, volume, dividends and drawings are hidden in compare mode. Chart > Clear Comparisons returns to the normal chart.
15. The Settings dialog
The same dialog is used in two ways:
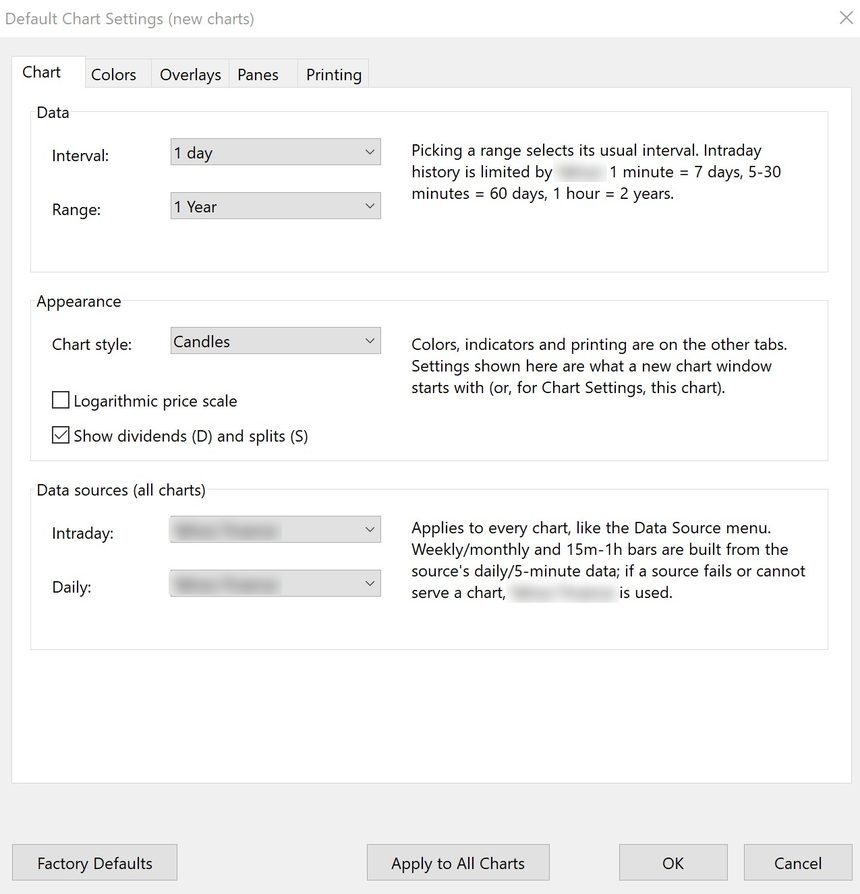
- Settings > Default Chart Settings (or the Settings toolbar button) sets what every new chart window starts with.
- Settings > Chart Settings (this chart), or ⚙ on the chart panel, changes the active chart only.
Buttons at the bottom: Factory Defaults resets the dialog to the built-in settings; Use My Defaults (in the per-chart dialog) loads your default settings; Apply to All Charts applies the dialog to every open chart at once and keeps the dialog open. The dialog reopens on the tab you used last.
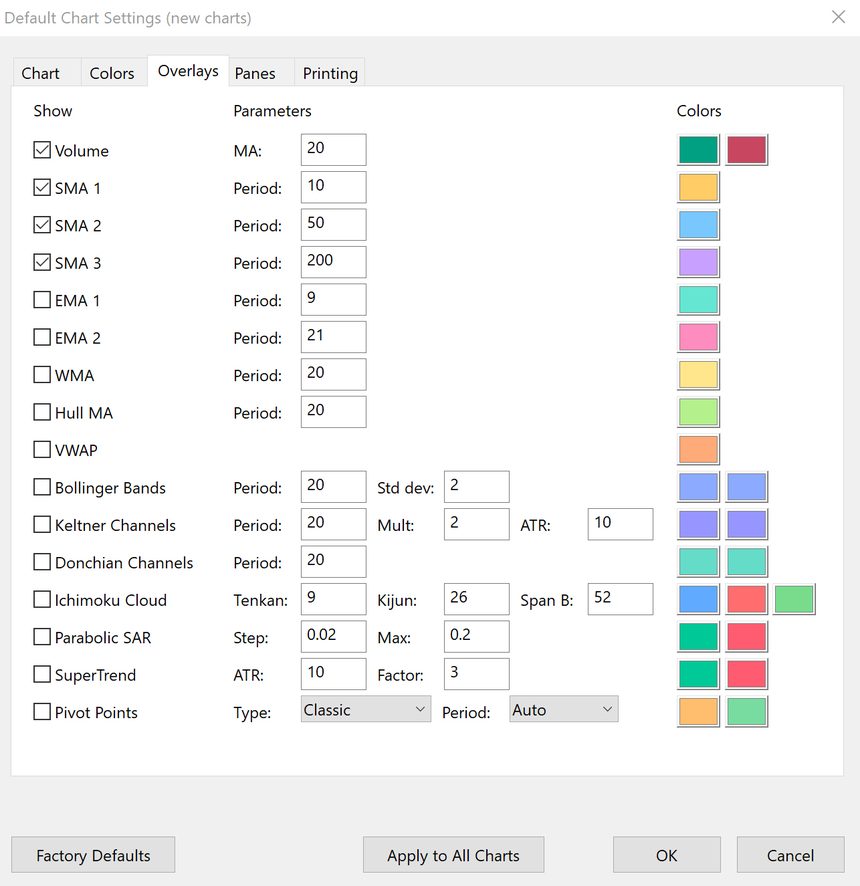
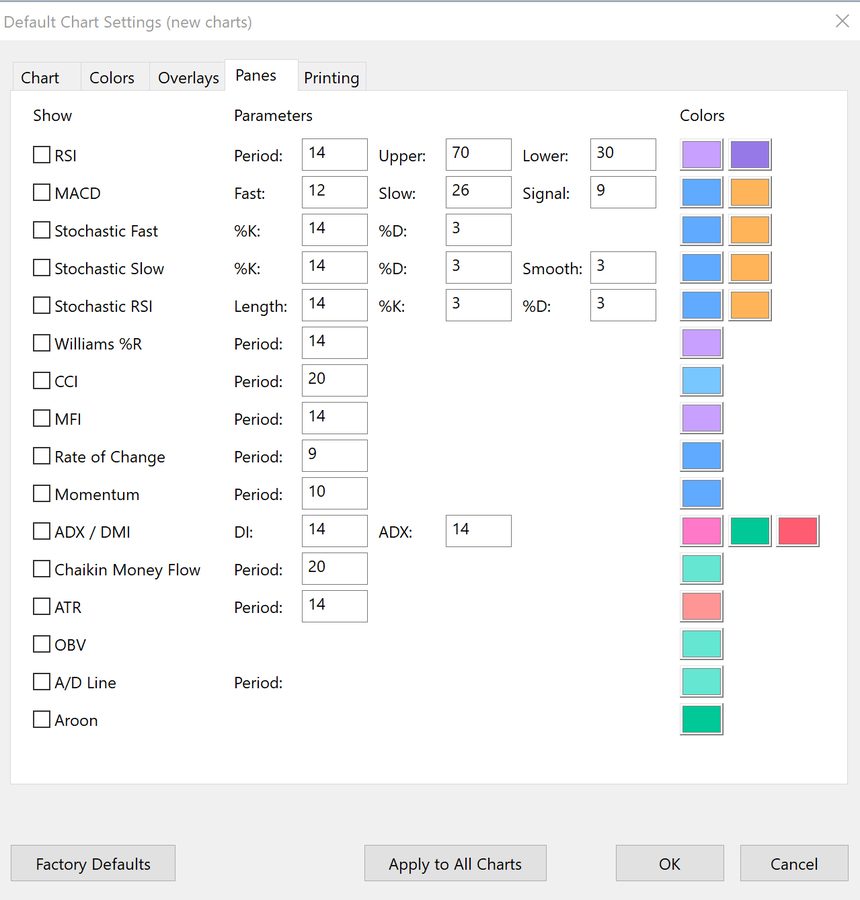
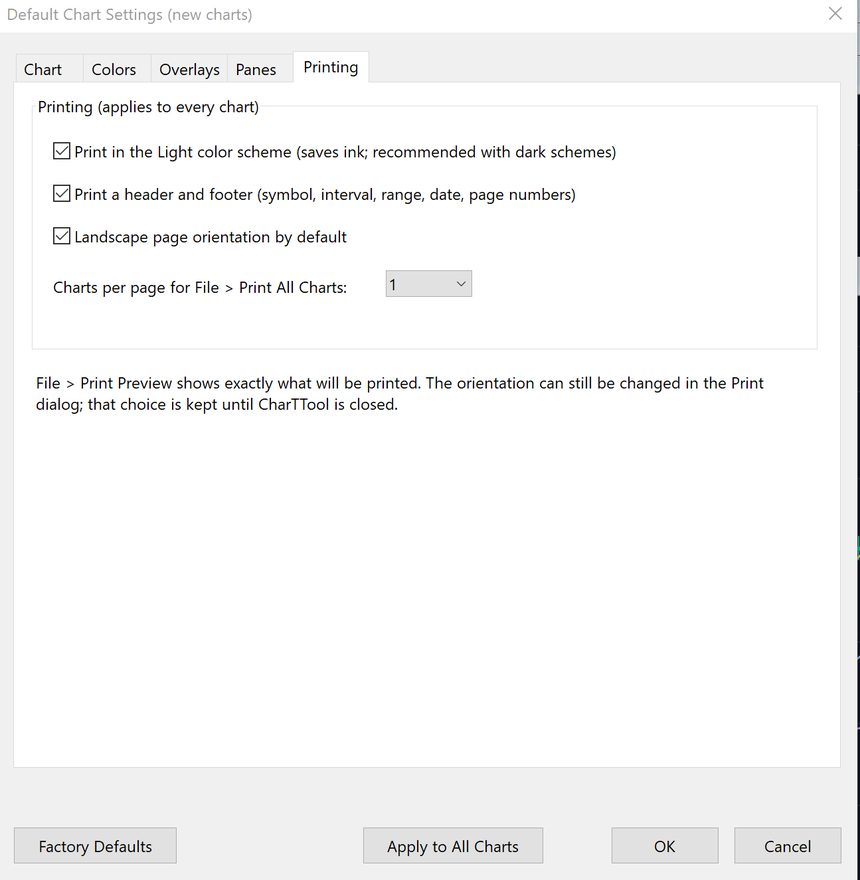
| Tab | Settings |
|---|---|
| Chart | Interval, range, chart style, logarithmic scale, dividend and split markers, and the data source for intraday and for daily charts (these two apply to every chart). |
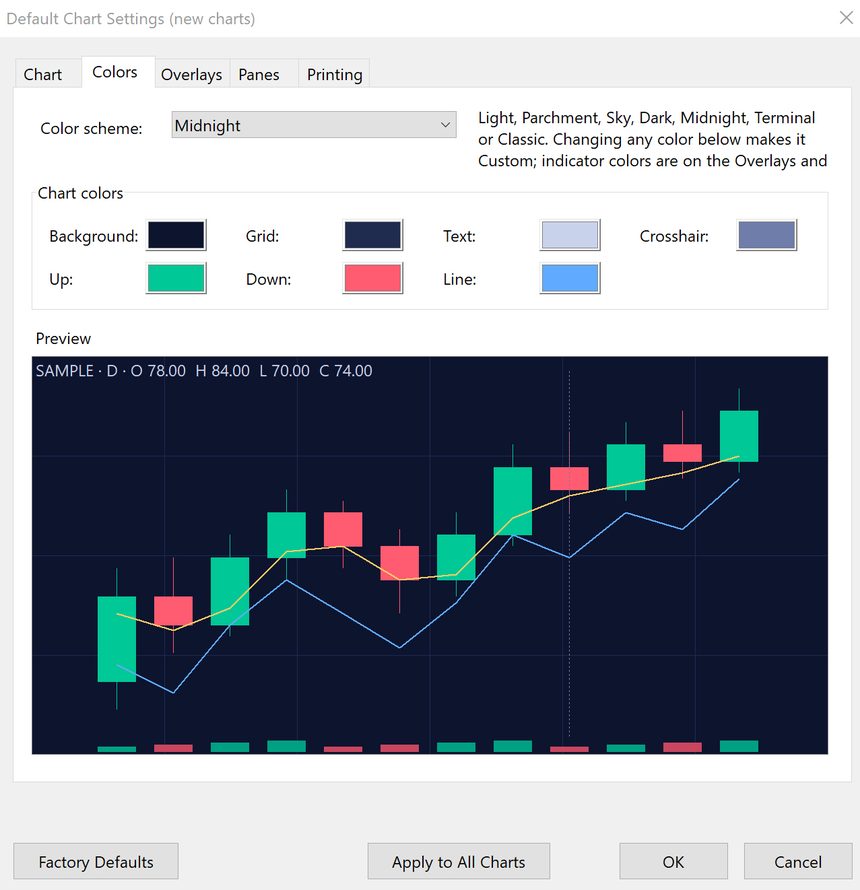
| Colors | Color scheme and the seven chart colors – background, grid, text, crosshair, up, down and line – with a live preview. |
| Overlays | On/off, parameters and colors of Volume, the moving averages, the bands and channels, Ichimoku, Parabolic SAR, SuperTrend and Pivot Points (type and period are drop-down lists). |
| Panes | On/off, parameters and colors of every pane indicator. ADX has three colors (ADX, +DI, −DI). |
| Printing | Print in the Light scheme, header and footer, landscape by default, charts per page for Print All Charts. These apply to every chart. |
16. Color schemes
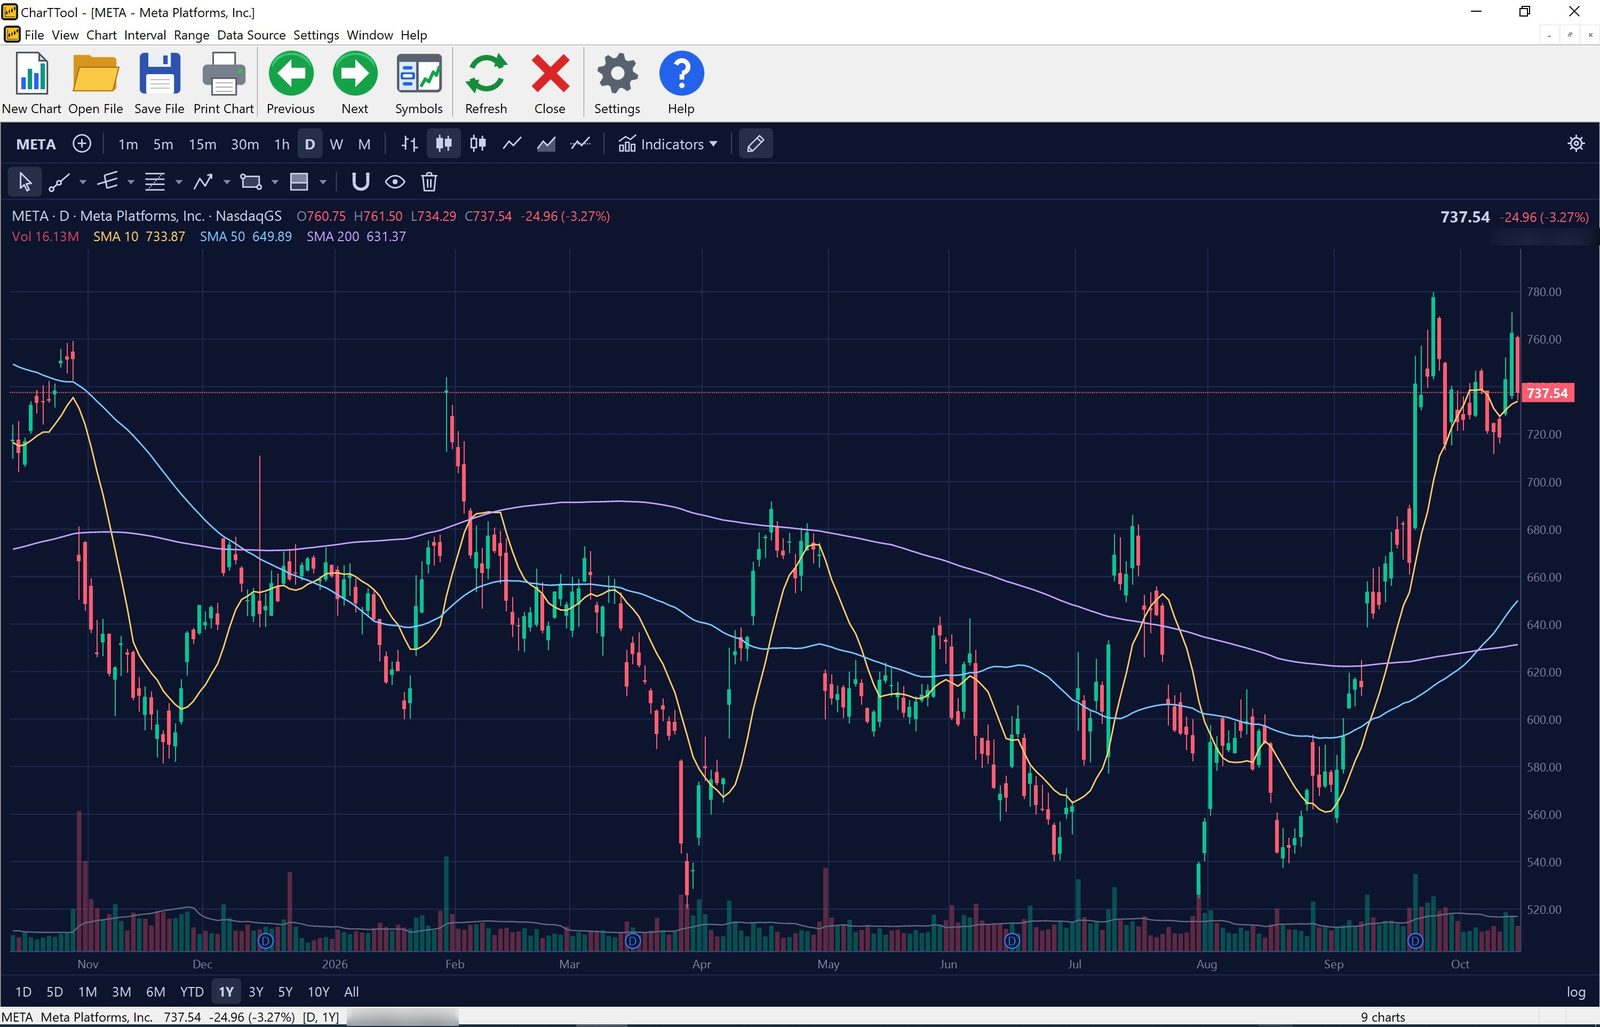
| Scheme | Look |
|---|---|
| Light | White background, green and red candles (default) |
| Parchment | Light warm yellow background, easy on the eyes |
| Sky | Light soft blue background |
| Dark | Dark gray background |
| Midnight | Deep navy background with soft pastel colors |
| Terminal | Black background with phosphor green and amber, like a trading terminal |
| Classic | The gray look of CharTTool 2.x |
Changing any single color turns the scheme into Custom. Indicator colors are set on the Overlays and Panes tabs. A scheme can be the default for new charts or set for one chart only, so you can, for example, keep index charts in Sky and stock charts in Light.
17. Printing and copying charts
- File > Print Chart (Ctrl+P) prints the active chart at full printer resolution, with a header (symbol, company name, interval, range and print date) and a footer with the page number.
- File > Print Preview shows exactly what will be printed.
- File > Print All Charts prints every open chart, 1, 2, 4 or 6 charts per page – a quick way to print a whole watch list.
- Printing is landscape by default. If you pick another orientation in the Print dialog, it is kept until CharTTool is closed.
- With Print in the Light color scheme on, charts with a dark scheme are printed on white to save ink.
- Chart > Copy Chart Image (Ctrl+C) copies the chart, with its indicators and drawings, as a picture you can paste into Word, an email or an image editor.
18. Data sources, cache and offline use
CharTTool downloads quotes from free internet sources; no account, subscription or API key is needed. The Data Source menu (also on the Chart tab of the Settings dialog) lets you pick one source for intraday charts and one for daily, weekly and monthly charts. The choice applies to every open chart and is remembered.
- The default source covers everything: all intervals, stocks, ETFs, funds, indices, futures and currencies, with company names, dividends and splits. The alternative sources cover fewer securities or less history; where one only supplies daily or 5-minute data, CharTTool builds weekly, monthly, 15-minute, 30-minute and 1-hour bars from it.
- Automatic fallback: if the selected source cannot serve a chart, or its request fails, the chart is loaded from the default source and the reason appears in orange at the right of the chart header. Futures and currencies always use the default source.
- Alternative sources do not provide company names, dividends or splits; the name is taken from an earlier download of the symbol when there is one.
Cache
Downloaded quotes are kept in a memory and disk cache, so switching between charts, intervals and sources is instant and the data is not downloaded again while it is fresh:
| Interval | Data is considered fresh for |
|---|---|
| 1 minute | 30 seconds |
| 5 minutes | 1 minute |
| 15 and 30 minutes | 2–3 minutes |
| 1 hour | 5 minutes |
| 1 day | 15 minutes |
| 1 week / 1 month | 1 hour / 6 hours |
F5 always downloads fresh data. When the internet connection is down, charts are drawn from the cache with an Offline – cached note. View > Clear Quote Cache deletes all cached quotes and downloads fresh data for the open charts. Downloads run in the background, several at a time, and are paced so that opening a long ticker list does not overload the data sources.
19. Keyboard and mouse reference
| Key or action | Command |
|---|---|
| Ctrl+N | New chart(s) |
| Ctrl+O / Ctrl+S | Open / save ticker list |
| Ctrl+W | Close chart |
| Ctrl+P | Print chart |
| Ctrl+C | Copy chart image |
| PgDn, Space | Next chart |
| PgUp, Shift+Space | Previous chart |
| F5 / Ctrl+F5 | Refresh this chart / all charts |
| Ctrl+1 … Ctrl+9, Ctrl+0 | Range 1D, 5D, 1M, 3M, 6M, YTD, 1Y, 3Y, 5Y, All |
| Mouse wheel, + / - | Zoom in / out |
| Drag, ← / → | Pan |
| Home, double-click | Reset zoom |
| Del | Delete the selected drawing (in the Symbols list: close the highlighted chart) |
| Ctrl+Z | Undo the last drawing change |
| Esc | Cancel the drawing being placed or dragged, then drop the tool |
| Ctrl while drawing | Reverse the magnet |
| F1 | This guide |
20. Command line and where settings are kept
CharTTool can be started with a ticker list or with symbols:
chrttool.exe "DOW-JONES.tlf"
chrttool.exe MSFT DELL AXP
Without arguments the last session reopens (when Reopen Charts on Startup is on). /nosplash skips the
splash screen.
All settings are kept in the registry under HKEY_CURRENT_USER\SOFTWARE\Ashkon Software\CharTTool:
| Key | Contents |
|---|---|
Defaults | The settings new charts start with |
Settings | Program options, data sources and window placement |
Session | The last layout: open charts with their settings and positions |
Drawings | One value per symbol with its drawings |
Ticker lists are ordinary files in Documents\Ashkon Software\CharTTool; copy them to move your lists to
another computer.
21. Troubleshooting - questions and answers
A chart says it has no data.
Check the symbol: indices start with ^, futures end with =F, currencies with =X, and
international stocks need an exchange suffix (see section 4). A delisted symbol no longer has quotes.
An intraday chart shows fewer days than the range I picked.
The free data sources keep 7 days of 1-minute bars, 60 days of 5 to 30-minute bars and 2 years of 1-hour bars, and CharTTool shortens the range to fit. Use a longer interval for more history.
The chart header shows an orange message.
The data source you selected could not serve this chart, so it was loaded from the default source. The message gives the reason. Choose another source on the Data Source menu if it keeps happening.
The chart shows “Offline – cached”.
CharTTool could not reach the internet and is showing the last data it downloaded. Press F5 when the connection is back.
My drawings disappeared.
Check that Chart > Hide Drawings (the eye button) is off and that no comparison symbols are on the chart – drawings are hidden on the percent scale. Drawings belong to the symbol, so they appear on any chart of that symbol.
An indicator does not appear.
Indicators are hidden while comparing symbols. VWAP restarts every day, so it is meant for intraday charts; on a daily chart it simply follows the typical price.
The Ichimoku cloud leaves empty space on the right.
That is intended: the cloud is plotted 25 bars ahead, and CharTTool leaves room for it.
My old CharTTool 2.x shows “Charting information is temporarily unavailable”.
Version 2.x can no longer download charts. Install version 3 from this site; your ticker lists open unchanged.
22. Registration and support
| Register (buy a license) | Order CharTTool online - $39.95 |
| Download | charttool.exe (mirror: quotelinks.com) |
| Help in the program | Help > Contents (F1) opens this guide |
| Program version | Help > About CharTTool |
| Product page | CharTTool |
| Chart gallery | CharTTool Chart Gallery - 24 example charts with technical analysis |
| Contact | Contact Us - questions about ordering: order@ashkon.com |