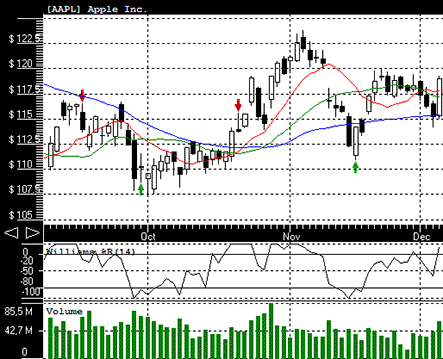
Williams %RWilliams %R is an inverse indicator to Fast Stochastic Oscillator. Williams %R is measured between 0 and -100 and reflects a level close to the highest high when looking back in a specified periods range. Values in 0/-20 range are considered that a stock is overbought, and values in a range -80 to -100 are considered and oversold.
These are two typical ways to generate stock signals using Williams %R: buy when Williams %R is falling below -80 and sell when Williams %R rises above -20 level; or buy when Williams is changing direction to an upward and sell when Williams %R goes into a downward direction.
Stock Predictor - chart Williams %R and run trading strategies using it.
AAPL MSFT AMZN GOOGL NVDA TSLA BRK.B GOOG XOM UNH JNJ JPM META V PG
Copyright © 2000-2023, Ashkon Software
L.L.C.
Privacy Policy | Disclaimer
