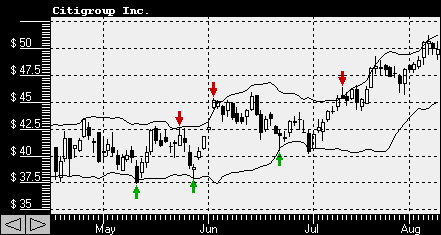
Bollinger Bands - Technical IndicatorsBollinger Bands use standard deviation as a measure of stock price historical volatility to compare stock price movements to the moving average levels. Having evolved from the concept of trading bands, Bollinger Bands usually consist of upper and lower bands and may include a moving average as a reference. Bollinger Bands were developed by John Bollinger in 1980s. The goal of Bollinger Bands is to provide a relative definition of high and low prices. By definition prices are high when they reach the upper band and low when they touch the lower band.
There are several observations that help you to interpret Bollinger Bands:
stock prices tend to stay within the upper and lower band; sharp price changes tend to occur after the bands tighten; when prices move outside the bands, a continuation of the current trend will continue; bottoms and tops made outside the bands are usually followed by bottoms and tops made inside the bands; a stock price move that originates at one band tends to go all the way to the other band.Bollinger Bands are calculated using the following formulas:
where D is standard deviation which is usually equal to 2 and n - moving averages periods which is usually equal to 20. MA is a simple moving average calculated as
A AIG PH CTVA MSCI GIS CMG JCI ADM COF FIS TRV KMB IQV MSI NUE CHTR
Copyright © 2000-2016, Ashkon Software L.L.C.
Privacy Policy | Disclaimer


