Stock Predictor Screenshots

Stock Predictor shows a stock chart, technical indicators and trading strategy buy and sell signals in one window. Chart colors and look are fully customizable.
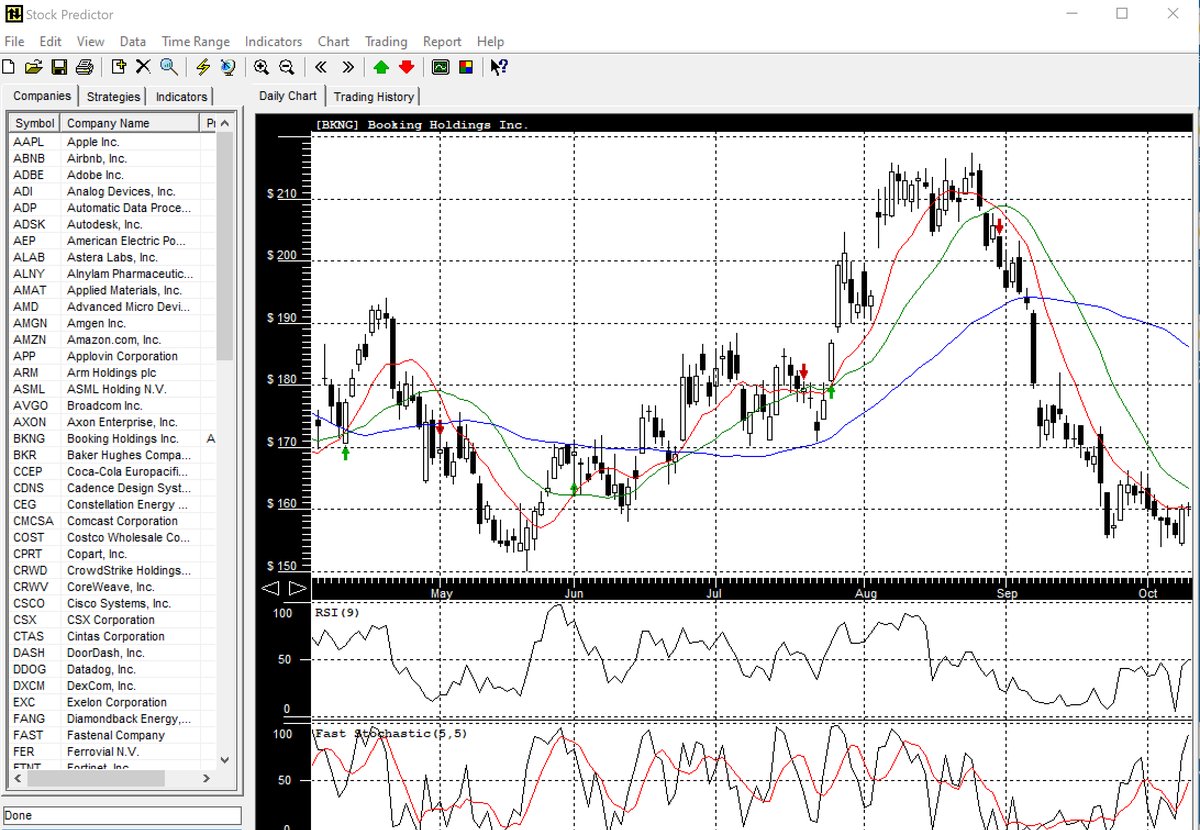
Stock Predictor main window: daily candlestick chart with moving averages, strategy buy and sell signals, RSI and Fast Stochastic
Current version: chart with indicators and strategy signals
Stock Predictor chart with a white background color scheme and Slow Stochastic indicator
White color scheme
Stock Predictor chart with a black background color scheme, volume and Fast Stochastic
Black color scheme
Stock Predictor chart with a gray color scheme
Gray color scheme
Stock Predictor chart with a yellow color scheme
Yellow color scheme
Download Stock Predictor free trial Product details User interface guide