
IP Monitoring Tool
IP Monitoring Tool User Guide
IP Monitoring Tool keeps an eye on your websites, servers and network devices. It checks each one on a schedule you set and tells you when something stops responding, recovers, changes or starts to look unhealthy. This guide walks through every feature of the program, from your first monitor to alerts, scripts and troubleshooting.
Contents
- Getting started in five steps
- Choosing a monitor type
- Creating and changing a monitor
- Adding a long list of addresses
- Reading the main window
- Running checks and continuous monitoring
- How you are alerted
- Reviewing what changed on a page
- The event log
- Program settings
- Running in the notification area
- Menu commands and keyboard shortcuts
- Exporting, printing and copying
- Moving from URL Monitoring Tool 2.x
- Solving common problems
- Requirements, files and licensing
1. Getting started in five steps
- Press Add on the toolbar (or the Insert key). Type a web address such as
https://www.example.com/, a host name or an IP address, pick a monitor type and confirm with OK. A URL already on the clipboard is entered for you. - Do the same for each site or server you care about. Have a long list? File > Add Multiple URLs lets you paste them all at once.
- Press Check Now to run every monitor once. The Status column reports Up, Down, Changed or Warning.
- Press Start. From now on each monitor runs at its own interval – even when the window is tucked away in the notification area.
- Open Settings and decide how you want to hear about problems: notifications, sounds or a script.
2. Choosing a monitor type
Every monitor tests one thing. Pick the type that matches the question you want answered:
| Monitor type | The check passes when… | You are alerted when |
|---|---|---|
| Web page (HTTP) | the server replies to the URL over HTTP or HTTPS with a success code (1xx–3xx), or with the exact code you asked for | the page goes down and when it comes back |
| Content change | – this type compares the page text with the text from the previous check | the content is different |
| Keyword | a chosen word or phrase is present on the page – or, if you prefer, absent | the condition is not met |
| Ping | the host answers ICMP echo requests over IPv4 or IPv6 | the host stops or starts answering |
| TCP port | a TCP connection to the port opens before the timeout | the port closes or reopens |
| DNS | the host name resolves; its IP addresses are saved and compared each time | resolution fails or the addresses change |
Which one should I use?
- Is my site online? – Web page.
- Does the page show what it should? – Keyword. Require your company name to be present, or make sure a message like “Database error” never appears.
- Has a page been updated? – Content change.
- Is a router, server or other device reachable? – Ping.
- Is my mail, FTP, SSH, database or Remote Desktop service accepting connections? – TCP port.
- Did someone change where my domain points? – DNS.
3. Creating and changing a monitor
To create a monitor press Add (Insert). To change one, select it and press Edit, hit Enter, or double-click the row. Edit > Duplicate makes a copy you can adjust – handy for watching another port on the same server.
General fields
| Monitor type | Any of the six types from section 2. |
| URL / Host name | Web page, content and keyword monitors need a full URL. A plain host name is treated as http://; type https:// yourself for secure sites. Ping, TCP port and DNS monitors take a host name or an IP address. |
| Name | An optional label for the list, notifications and the event log. Leave it blank to show the URL or host instead. |
| Port | Only for TCP port monitors. Pick a well-known service – HTTP 80, HTTPS 443, FTP 21, SSH 22, SMTP 25/465/587, POP3 110/995, IMAP 143/993, DNS 53, LDAP 389, SMB 445, SQL Server 1433, Oracle 1521, MySQL 3306, PostgreSQL 5432, Redis 6379, MongoDB 27017, Remote Desktop 3389, VNC 5900, 8080 – or enter any port from 1 to 65535. |
| Check every | How often the monitor runs: anything from 10 seconds to 7 days, set in seconds, minutes or hours. |
| Timeout | How long to wait for a reply, between 2 and 120 seconds. |
| Failures before alert | The number of failed checks in a row needed before the monitor turns Down and you are alerted. 0 means “use the value from Settings”. After a failed check the monitor is retried within 30 seconds, so a genuine outage is confirmed fast. |
| Monitor enabled | Untick to pause the monitor while keeping it in the list. |
Options for web pages and servers
| Use HEAD request | Requests the page headers only, which is quicker and lighter on traffic. A few servers don’t support it – if a site that works in your browser shows as down, turn this off. |
| Ignore TLS certificate errors | Accepts self-signed, expired or mismatched certificates, which is typical for intranet servers. Without it, certificate problems are reported along with the reason. |
| Expected HTTP status code | 0 accepts any success code. Enter a specific code, such as 200 or 301, to insist on exactly that response. |
| Warn when slower than | Raises a Warning when the response takes longer than this many milliseconds. 0 turns it off. |
| Warn when the TLS certificate expires within | Raises a Warning this many days before an HTTPS certificate runs out. |
Options for page content
| Keyword | The text to search for, combined with either Alert when the text is missing or Alert when the text appears. |
| Match case | Treats upper and lower case as different. |
| Compare visible text only | Skips HTML tags and scripts, so only what a visitor actually reads is compared or searched. |
| Ignore numbers | Skips digits, so hit counters, dates, clocks and prices don’t count as a change. |
Before saving, press Test Now to try the monitor with its current settings. The result and response time appear next to the button.
4. Adding a long list of addresses
- Paste a list – File > Add Multiple URLs accepts URLs or host names one per line; spaces, commas and semicolons work as separators too. Choose a monitor type and an interval in minutes. Anything already in the list is skipped.
- Import a file – File > Import URL List reads a plain text file with one address per line, or a CSV file exported from IP Monitoring Tool.
- Drag and drop – drop text files or Internet shortcuts (
.url) onto the window. To make a shortcut, drag the address from your browser’s address bar onto the desktop.
5. Reading the main window
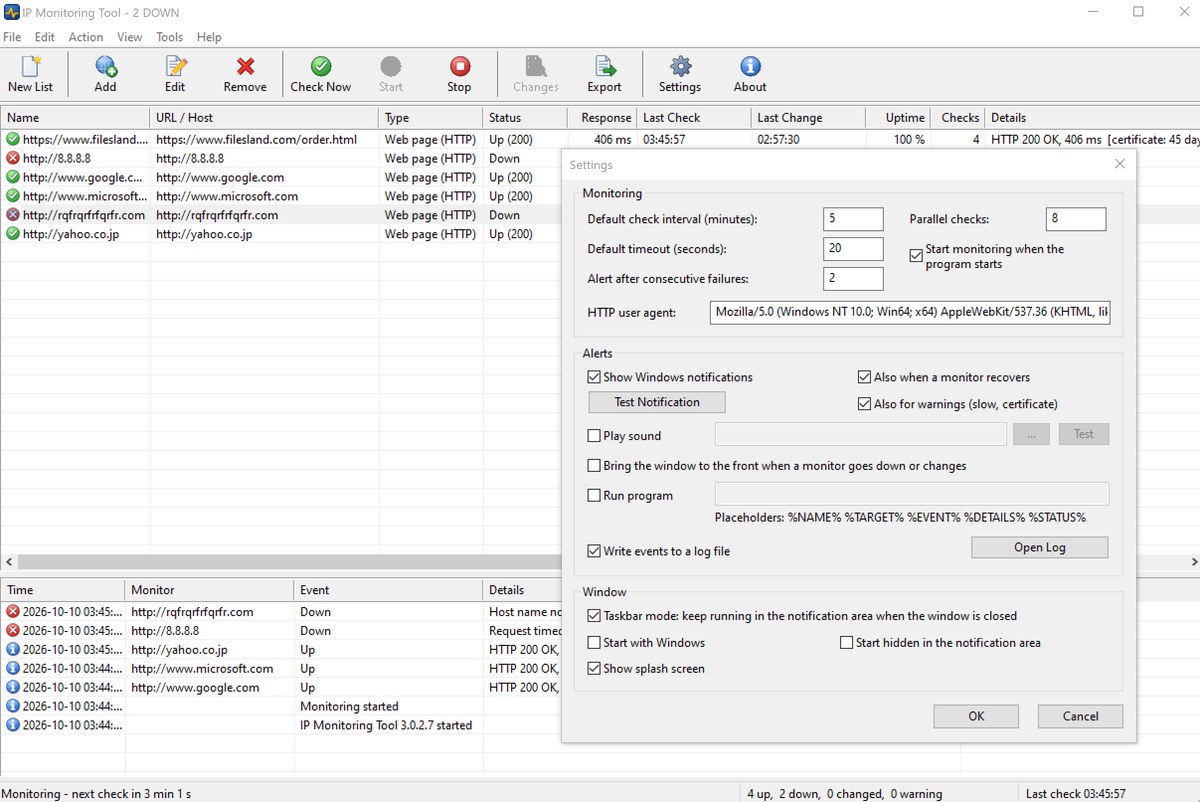
Each row of the upper list is one monitor. Click a column heading to sort by it, or drag a heading to move the column. The program remembers your column widths and order.
| Column | Shows |
|---|---|
| Name, URL / Host | The monitored target. |
| Type | The kind of monitor. |
| Status | Up (with the HTTP status code), Down, Changed, Warning, Paused, Checking… or Not checked. The colored icon next to the name mirrors it. |
| Response | Response time of the most recent check, in milliseconds. |
| Last Check, Last Change | When the monitor last ran, and when its status or content last changed. |
| Uptime, Checks | Share of successful checks and how many checks have run. Action > Reset Statistics starts both from zero. |
| Details | The outcome of the last check – for example “HTTP 200 OK, 406 ms” – the reason it failed, or the days left on the TLS certificate. |
Drag the splitter between the list and the event log to resize them; View > Event Log hides the log. The status bar tells you whether monitoring is running, when the next check is due, how many monitors are up, down, changed or in warning, and when the last check ran. Problems also show in the window title and on the taskbar button – for example “IP Monitoring Tool - 2 DOWN”.
6. Running checks and continuous monitoring
- Check Now (Ctrl+F5) runs every monitor right away. Action > Check Selected Now (F5) runs only the selected ones.
- Start turns on continuous monitoring, with each enabled monitor running at its own interval. Stop turns it off. To begin automatically, tick “Start monitoring when the program starts” in Settings.
- Edit > Pause / Resume suspends or resumes the selected monitors.
- Checks run side by side – 8 at once by default and up to 32 – so one slow server never holds up the rest.
- Action > Open in Browser opens the selected page in your default browser.
7. How you are alerted
An alert is raised when a monitor goes down, when it recovers, when page content or DNS addresses change, and – if you want – for warnings such as slow responses or a certificate close to expiry. Pick your alerts under Settings > Alerts:
- Windows notifications – a pop-up in the corner of the screen that also stays in the notification center. Several simultaneous events are grouped into one notification. Clicking it opens the program with the monitor selected. Use Test Notification to preview it. If nothing appears, make sure notifications are enabled in Windows Settings > System > Notifications and that Focus assist / Do not disturb is off.
- Play sound – the default Windows sound, or a WAV file chosen with the “…” button.
- Bring the window to the front whenever a monitor goes down or changes.
- Run program – starts a program or script and passes details of the event to it. Use it to send an e-mail or chat message, restart a service or write your own log.
Placeholders for Run program
| Placeholder | Replaced with |
|---|---|
%NAME% | the monitor’s name |
%TARGET% | the URL or host |
%EVENT% | what happened, e.g. Down, Back up, Content changed |
%DETAILS% | details of the check |
%STATUS% | the new status |
Example command line:
C:\Scripts\alert.cmd "%NAME%" "%EVENT%" "%DETAILS%"
8. Reviewing what changed on a page
A content change monitor keeps the text of the two most recent versions of the page. When the text changes, the monitor stays Changed until you have looked at it. Select the monitor and press Changes on the toolbar – or double-click it – to open the Changes window. Added and removed lines are highlighted, and a summary tells you how many lines were added and removed and when the change was found. Untick Show only changed lines to read the full page text.
- Open Page shows the page in your browser.
- Mark as Seen sets the monitor back to Up, ready to report the next change. Action > Mark All Changes as Seen clears every monitor at once.
- Getting a change on every check because of counters, dates or ads? Turn on Compare visible text only and Ignore numbers for that monitor.
DNS monitors behave the same way: the first check saves the host’s IP addresses, and any later difference in that set triggers an alert.
9. The event log
New events are added at the top of the log with the time, the monitor, what happened and the details. Logged events include program start, monitoring started or stopped, Up, Down, Back up, Content changed, DNS addresses changed, Warning and Change marked as seen. Double-click an event to jump to its monitor. Right-click the log to Copy the selected entries, Save Event Log as CSV, or Clear Event Log.
For a permanent record, tick “Write events to a log file” in Settings; Open Log shows the file. It is stored in %LOCALAPPDATA%\IP Monitoring Tool and rotated automatically once it gets large.
10. Program settings
Open them with Settings on the toolbar or Tools > Settings.
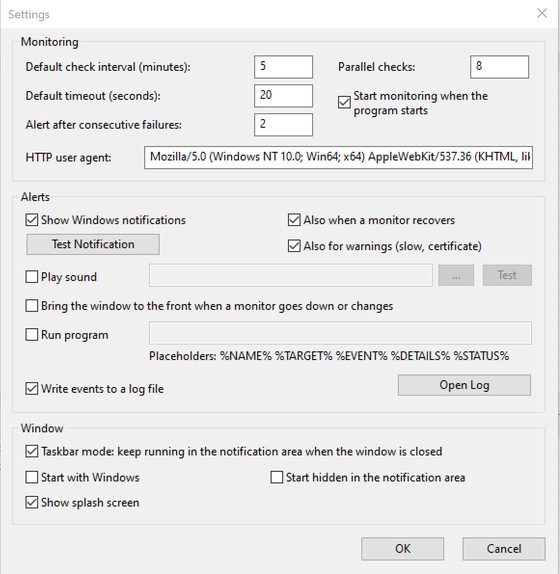
Monitoring
| Default check interval | Minutes between checks for newly added monitors (5 by default). |
| Default timeout | Seconds to wait for new monitors (20 by default). |
| Alert after consecutive failures | Applies to monitors whose own “Failures before alert” is 0 (2 by default). |
| Parallel checks | How many checks may run together, from 1 to 32 (8 by default). |
| Start monitoring when the program starts | Begins monitoring automatically on launch. |
| HTTP user agent | The browser name sent to web servers. Keep the default unless a site rejects unfamiliar browsers; empty the field to go back to the default. |
Alerts
| Show Windows notifications | Optionally also when a monitor recovers, and for warnings (slow response, certificate). |
| Play sound | A Windows sound or your own WAV file; Test plays it. |
| Bring the window to the front | When a monitor goes down or changes. |
| Run program | A command line with placeholders – see section 7. |
| Write events to a log file | Open Log opens the file. |
Window
| Taskbar mode | Keep running in the notification area when the window is closed or minimized. |
| Start with Windows | Launch the program when you sign in. |
| Start hidden in the notification area | Don’t show the window on launch. |
| Show splash screen | Display the splash screen on launch. |
11. Running in the notification area
With taskbar mode on, closing or minimizing the window doesn’t stop anything – the program carries on from the notification area beside the clock. The color of its icon sums up the situation:
| Green | Every monitor is up. |
| Red | One or more monitors are down. |
| Orange | A page or DNS record has changed, or a monitor is in warning. |
| Gray | Monitoring is stopped or there are no monitors. |
Hover over the icon for a count of monitors in each state. Click it to open the window; right-click it for Check All Now, Start Monitoring, Stop Monitoring, Settings and Exit. To quit completely use File > Exit or Exit in the tray menu.
Only one copy runs at a time – launching it again just brings up the running copy. View > Taskbar Mode switches taskbar mode on or off quickly, and View > Always on Top keeps the window above others.
12. Menu commands and keyboard shortcuts
| Menu | Commands |
|---|---|
| File | New List, Add Monitor, Add Multiple URLs, Remove, Import URL List, Export Results (CSV), Save Event Log, Print, Exit |
| Edit | Edit Monitor, Duplicate, Delete, Pause / Resume, Copy URL / Host, Select All |
| Action | Check All Now, Check Selected Now, Start / Stop Monitoring, Open in Browser, Show Changes, Mark Change as Seen, Mark All Changes as Seen, Reset Statistics |
| View | Taskbar Mode, Always on Top, Event Log |
| Tools | Settings, Clear Event Log |
| Help | Online Help (F1), Register, About IP Monitoring Tool |
The most-used commands are also on the right-click menu of the monitor list.
| Shortcut | Does |
|---|---|
| Insert, Ctrl+N | Add a monitor |
| Enter | Edit the selected monitor |
| Delete | Remove the selected monitors |
| F5 | Check the selected monitors now |
| Ctrl+F5 | Check every monitor now |
| Ctrl+A | Select all monitors |
| Ctrl+C | Copy the URL / host of the selection (in the event log: copy the selected events) |
| Ctrl+P | Print the list |
| F1 | Open this help |
| Esc | Hide the window to the notification area (taskbar mode) |
13. Exporting, printing and copying
- Export on the toolbar, or File > Export Results (CSV), saves the whole list with every column to a CSV file you can open in Excel – and import again later with File > Import URL List.
- File > Save Event Log writes the event log to a CSV or text file.
- File > Print (Ctrl+P) prints the monitor list.
- Edit > Copy URL / Host (Ctrl+C) puts the addresses of the selected monitors on the clipboard.
14. Moving from URL Monitoring Tool 2.x
IP Monitoring Tool 3.0 is the successor of URL Monitoring Tool. Setup closes and uninstalls the old program, and on its first start the new version brings over your URL list and settings by itself – the event log reports how many URLs were imported. Every imported URL becomes a web page monitor; edit them to take advantage of the new monitor types and options.
15. Solving common problems
A site that works is reported as Down
Read the Details column first. Then try turning off Use HEAD request, raising the timeout, or setting the expected status code. Some sites answer 403 to programs they don’t recognize – in that case keep the default user agent.
Certificate errors
Messages such as “TLS certificate expired”, “name does not match” or “not trusted” mean your visitors see a browser warning as well. For internal servers with a self-signed certificate, turn on Ignore TLS certificate errors.
Ping fails although the site is fine
Lots of servers and firewalls drop ping requests. Switch to a web page or TCP port monitor.
Too many content change alerts
Turn on Compare visible text only and Ignore numbers, or replace the monitor with a keyword monitor.
Brief outages trigger alerts
Raise Failures before alert so a single missed check doesn’t count.
The site is unreachable only for you
A DNS problem at your internet provider, or a network fault somewhere on the route, can make a site unreachable from some places only. Test from a different network or device before you contact your hosting company.
16. Requirements, files and licensing
IP Monitoring Tool runs on Windows 7, 8, 8.1, 10 and 11 (32-bit and 64-bit) and needs internet or network access to the sites and servers it watches. Your monitor list and settings are kept per Windows user; the event log file and page snapshots live in %LOCALAPPDATA%\IP Monitoring Tool. Uninstalling removes the program, its shortcuts, the “Start with Windows” entry, the log file and the snapshots.
You can try IP Monitoring Tool free for 30 days. To keep using it afterwards, buy a license for $19.95 – choose Help > Register in the program, or use the Buy now button on this page.
Need help? See the IP Monitoring Tool product page or contact us. Questions about ordering: order@ashkon.com.