Bollinger Bands Definition - Stock Trading Terms
|
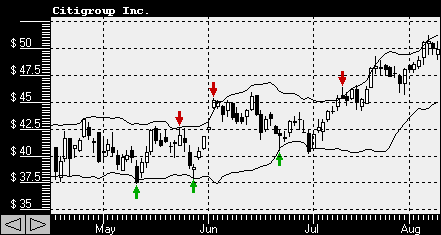
Bollinger Bands is a widely used technical
analysis tool in trading that consists of a moving average and two
bands, one above and one below the moving average. The bands are
plotted based on the standard deviation of the price of a security or
other financial instrument. The bands are calculated by taking the moving average of the price of the security over a specific time period, usually 20 periods, and then adding or subtracting two standard deviations from the moving average. The standard deviation is a measure of how much the price of the security has varied over the same time period. The upper band represents the highest point that the price of the security is expected to reach, while the lower band represents the lowest point. The area between the upper and lower bands is known as the "Bollinger Band channel." The width of the channel varies depending on the level of volatility in the security; if the security is highly volatile, the bands will be further apart, and if it is less volatile, they will be closer together.  Bollinger Bands are commonly used to identify areas of support and resistance in the price of a security. When the price of the security is near the upper band, it may be considered overbought, meaning that it has risen too far, too fast, and is likely to fall. Conversely, when the price of the security is near the lower band, it may be considered oversold, meaning that it has fallen too far, too fast, and is likely to rise. Traders use these signals to inform their buy and sell decisions. In addition to identifying areas of support and resistance, Bollinger Bands can also be used to measure volatility and trend strength. When the bands are narrow, it indicates low volatility, while wider bands indicate higher volatility. This can help traders to adjust their strategies and risk management plans accordingly. Bollinger Bands are also commonly used in conjunction with other technical indicators, such as the Relative Strength Index (RSI) or Moving Average Convergence Divergence (MACD), to provide additional signals for traders to consider. While Bollinger Bands can be a useful tool in trading, it is important to note that they are not infallible and can sometimes generate false signals. Traders should always use multiple forms of analysis and risk management strategies when making trading decisions. Overall, Bollinger Bands are a popular technical analysis tool that can provide valuable insights into the price movements of a security. By understanding how they work and how to interpret their signals, traders can use Bollinger Bands to inform their trading decisions and potentially improve their returns. |
Copyright © 2000-2024, Ashkon Software LLC
Privacy Policy | Refund Policy
| Disclaimer