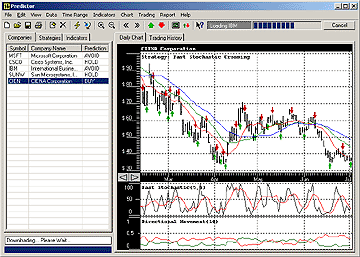
Williams %R Change Direction
This strategy is based on an absolute values of
Williams %R. Typically when Williams %R reaches level of -20 it is considered
that a security is overbought and when Williams %R is hitting -80 it is
considered that a security is oversold. The current strategy does the following
: it generates a buy signal when Williams %R is less than lower limit w (w = -
90 by default) and changing in an upward direction and generates sell signal
when Williams %R is greater than the upper limit v (v = - 10 by default) and
changing the direction downwards. Also a stop loss sell signal is included, it
is triggered when the current closing price falls lower the last buying price
minus %p (stop loss percentage)
The strategy is a technical analysis
trading strategy that uses the Williams %R indicator to generate buy
and sell signals based on specific criteria.
The Williams %R
indicator is a momentum oscillator that measures the level of oversold
or overbought conditions in a security. When the indicator is above
-20, it is considered overbought, and when it is below -80, it is
considered oversold.
In this strategy, a
buy signal is generated when the Williams %R is less than a specified
lower limit (w = -90 by default) and changing in an upward direction.
This indicates a potential reversal or correction in the stock's price
trend, and a buy signal is generated.
Similarly, a sell
signal is generated when the Williams %R is greater than a specified
upper limit (v = -10 by default) and changing in a downward direction.
This indicates a potential reversal or correction in the stock's price
trend, and a sell signal is generated.
To limit potential
losses, a stop-loss sell signal is also included. This is triggered
when the current closing price falls below a specified percentage (p
percent) from the last buying price.The strategy you described is a
technical analysis trading strategy that uses the Williams %R
indicator to generate buy and sell signals based on specific criteria.
The Williams %R indicator is a momentum oscillator that measures
the level of oversold or overbought conditions in a security. When the
indicator is above -20, it is considered overbought, and when it is
below -80, it is considered oversold.
In this strategy, a buy
signal is generated when the Williams %R is less than a specified
lower limit (w = -90 by default) and changing in an upward direction.
This indicates a potential reversal or correction in the stock's price
trend, and a buy signal is generated.
Similarly, a sell signal
is generated when the Williams %R is greater than a specified upper
limit (v = -10 by default) and changing in a downward direction. This
indicates a potential reversal or correction in the stock's price
trend, and a sell signal is generated.
To limit potential
losses, a stop-loss sell signal is also included. This is triggered
when the current closing price falls below a specified percentage (p
percent) from the last buying price.
Formula
IF Williams(t-1) > Williams(t) AND
Williams(t-1) > v
THEN GO SHORT
ELSE
IF Williams(t-1) < Williams(t) AND
Williams(t-1) < w
THEN GO LONG
AND C(t)-BUY_PR<-BUY_PR*p/100 THEN SELL
and v > w; e.g. v = -10,w = -90,
C(t) - closing price; p - percentage loss
BUY_PR last buying price;
Stock Research Links
DOV
ETN
ERIE
PAYX
ORI
CSL
HD
CLX
ES
FDS
FUL
SWX
<
Back to Stock Predictor Site
|

Order
>
|
Copyright © 2000-2023, Ashkon Software
L.L.C.
Privacy
Policy | Disclaimer
|