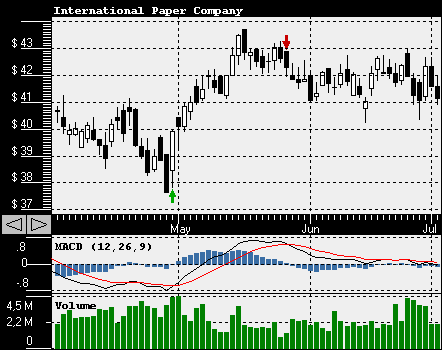
MACD - Technical IndicatorsUsually MACD (Moving Average Convergence Divergence) is calculated by subtracting 26-day simple moving average from 12-day simple moving average. Signal line is usually calculated as a 9-day simple moving average of MACD (red color). Convergence - Divergence is the difference between MACD and signal line (blue color).
Typically a "buy" signal is generated when MACD is rising above the signal line and
a "sell" signal is generated when MACD is falling below the signal line. In other words when divergence becomes positive this can be interpreted as buy signal and when divergence becomes negative this is a sell signal.MACD is calculated using the following formulas:
IBM BA CVS INTU PLD ELV INTC DE MDT LMT BLK GILD AXP AMT AMAT C BKNG
Copyright © 2000-2023, Ashkon Software
L.L.C. Telecom Directory
Privacy Policy | Disclaimer
