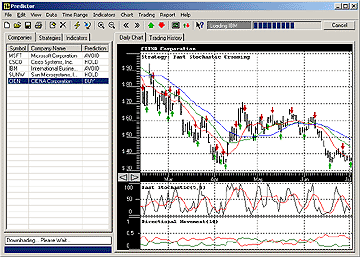
Directional Movement
Directional Movement, also known as the Average
Directional Index (ADX), is a technical analysis indicator that measures the
strength of a stock's trend. The indicator is derived from two other indicators
known as the Positive Directional Indicator (+DI) and the Negative Directional
Indicator (-DI).
The +DI measures upward movement in price, while the
-DI measures downward movement in price. The ADX indicator is calculated by
taking the difference between the +DI and -DI and dividing it by the sum of the
+DI and -DI. The resulting value is then smoothed using a moving average.
The ADX indicator ranges from
0 to 100, with values above 25 indicating a strong trend in either direction.
Values below 25 indicate a weak or range-bound market. Traders may use the ADX
to confirm a trend and to identify potential entry and exit points for their
positions in the stock.
This strategy is based on the Directional
Movement Index (DMI) When a Positive Directional Movement (+DM) is crossing
Negative Directional Movement (-DM) in an upward direction then a buy signal is
generated. A sell signal is generated when +DM is crossing -DM in a downward
direction.
Copyright © 2000-2023, Ashkon Software
L.L.C.
Privacy
Policy | Disclaimer
|

